GBP/USD Analysis: The pair is trading within a range, with support gradually strengthening and resistance levels continuing to exert downward pressure.
2026-08-10 19:58:55
On Monday (August 10), the British pound against the US dollar exhibited a consolidation pattern of "slow rise → sharp fall → strong rebound" over the past five trading days. Bullish momentum continued to recover, with lows gradually rising, but significant selling pressure was encountered at the key psychological resistance level of 1.3500. Currently, it is maintaining a narrow range of fluctuation at high levels, with a temporary balance between bulls and bears. Whether it can hold above 1.3500 will determine its medium-term direction. The British pound remains trapped within a wide trading range that has lasted for 15 months. However, the current flat sideways movement contains signals worthy of deeper analysis than a stable trend. The market has repeatedly attempted to break higher, but has consistently failed to generate sustained buying support, making it impossible to determine a clear medium-term direction.  This puts traders in a familiar yet tricky situation: neither the bulls nor the bears are willing to concede defeat, while the underlying balance of power is subtly shifting. The key is not the speed of price fluctuations, but rather that this period of consolidation will ultimately reveal which side—the bulls or the bears—is more likely to dominate the medium-term trend. The GBP/USD pair is showing subtle shifts in bullish and bearish forces . Recent price action hasn't broken the large-scale consolidation pattern, but the pullback has shown subtle bullish changes. Bears have repeatedly attempted to exert pressure, but each time the price hasn't fallen sharply, buying pressure has emerged. This change is significant; previously, whenever bullish momentum waned, GBP/USD tended to weaken further, but now the support at lower levels has clearly increased. At the same time, every attempt to push higher has been met with selling pressure. Compared to the beginning of the week, the current balance of power is more even: bulls are willing to actively defend the downside, but when the price touches the upper limit of the range, they are still unable to maintain control of the market. Therefore, the subsequent market trend depends more on which side—bulls or bears—can break free from the current wait-and-see sentiment and develop clear, one-sided trading confidence than on financial news. $1.3500 is a key strong resistance level, while support below is quietly rising . From a technical perspective, three key price levels deserve close attention: The psychological level of $1.3500 remains a key resistance level. The exchange rate has repeatedly approached this point but has been rejected and fallen back, indicating a large amount of selling pressure and profit-taking near this price level, making a sustained upward move difficult. Even if the price briefly breaks through 1.3500, it does not represent a trend reversal; a truly effective bullish signal is a daily closing price that holds above 1.3500 and subsequently remains stable above this level. The $1.3435 level has formed a very strong key support in recent days. The importance of this level is not simply due to its chart position, but because significant buying support has appeared every time the price falls to this level, making it the most important defensive barrier for the bulls. GBP/USD hourly chart .
 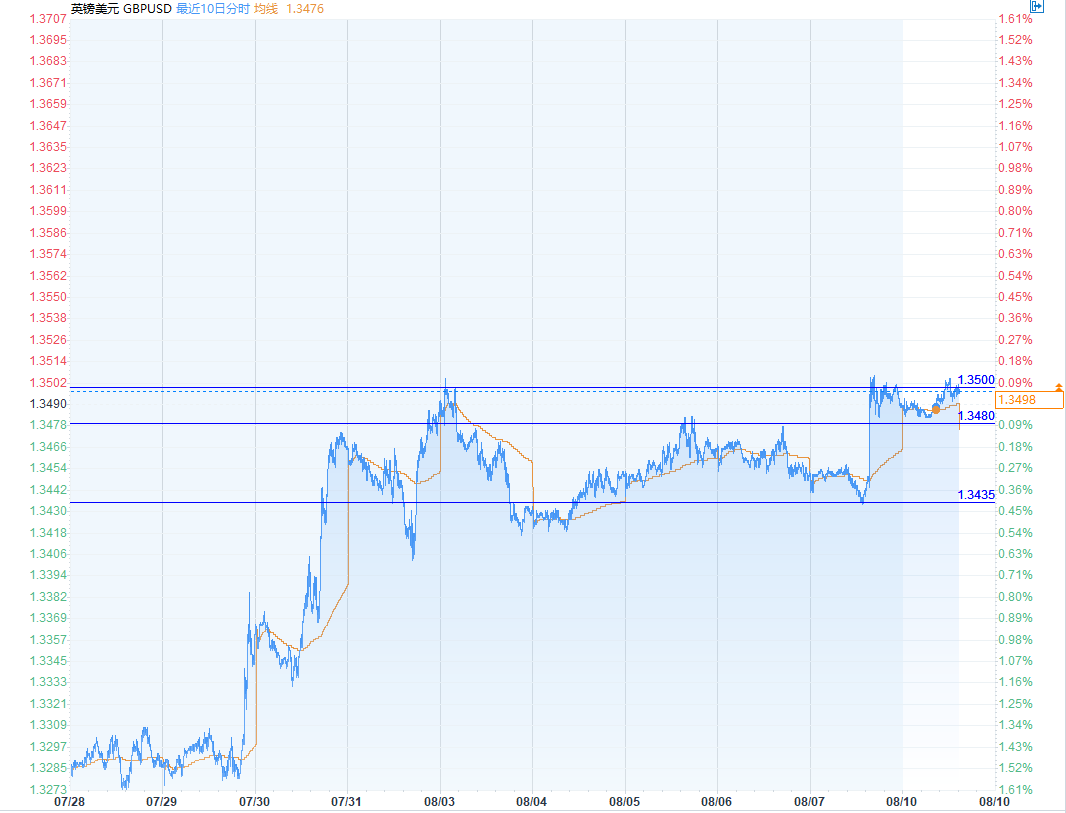 (GBP/USD hourly chart source: FX168) The newly formed intraday support level is $1.3480, which held throughout the Asian session today. This level can be considered a short-term intraday support/resistance level, but its strength is far less than that of $1.3435. If the exchange rate holds above $1.3480, the price will remain in the upper half of the range; however, a break below this level would likely lead to a test of the $1.3435 area for the remainder of Monday's trading session, and even Tuesday and Wednesday. The highly influential US Consumer Price Index (CPI) data will be released on Wednesday, significantly impacting the exchange rate. Range-bound trading is prone to misjudgments. Traders often fall into the trap of concluding that an upward breakout is imminent simply because the support level is strengthening. A strengthening support level has two possibilities: either genuine buying demand is entering the market, or the market is generally in a wait-and-see mode, with neither bulls nor bears willing to open large positions. Even if the downside is limited, repeated failures to break through key resistance levels will gradually erode bullish confidence. Furthermore, traders often fall into a psychological trap: believing that narrow-range fluctuations signify an impending major market move. Sideways trading ranges can sometimes be a consolidation phase for a trending market, or simply the market awaiting significant data or news for a repricing. The difference often becomes clear only after the market has moved. Currently, the market is characterized by bulls actively accepting declines while bears continue to suppress rallies, indicating a stalemate between bulls and bears, with no clear winner yet. Two scenarios will fundamentally alter the current market interpretation: Optimistic Bullish Scenario Strong support levels are an early signal that the exchange rate is gradually stabilizing at higher levels. If GBP/USD continues to hold above 1.3480, and subsequently breaks through and stabilizes above 1.3500, the current repeated rallies and pullbacks will be defined as consolidation during an uptrend, rather than selling pressure from above. Short-selling pressure scenario Another weakening logic also holds true: if the exchange rate encounters strong resistance again at 1.3500 and subsequently breaks below 1.3480, it will completely weaken the bullish logic, and the strong support at 1.3435 will face a severe test. If the key support at 1.3435 is breached, it indicates that the recent bullish momentum is merely a temporary illusion and lacks sustainability. Subsequent price tests will verify the true strength of the bulls and bears . Currently, there is no clear one-sided trend; all market signals are hidden in the price's reaction to key levels. Whether 1.3480 can hold as the intraday low and whether 1.3500 will again suppress further gains—the repeated testing of these two price levels will reflect the true strength of market supply and demand more directly than a single candlestick. The market will provide a clear answer in the next few trading days: will the current rising support completely reverse the overall oscillating pattern, or will the resistance at 1.3500 continue to firmly limit upward movement?
This puts traders in a familiar yet tricky situation: neither the bulls nor the bears are willing to concede defeat, while the underlying balance of power is subtly shifting. The key is not the speed of price fluctuations, but rather that this period of consolidation will ultimately reveal which side—the bulls or the bears—is more likely to dominate the medium-term trend. The GBP/USD pair is showing subtle shifts in bullish and bearish forces . Recent price action hasn't broken the large-scale consolidation pattern, but the pullback has shown subtle bullish changes. Bears have repeatedly attempted to exert pressure, but each time the price hasn't fallen sharply, buying pressure has emerged. This change is significant; previously, whenever bullish momentum waned, GBP/USD tended to weaken further, but now the support at lower levels has clearly increased. At the same time, every attempt to push higher has been met with selling pressure. Compared to the beginning of the week, the current balance of power is more even: bulls are willing to actively defend the downside, but when the price touches the upper limit of the range, they are still unable to maintain control of the market. Therefore, the subsequent market trend depends more on which side—bulls or bears—can break free from the current wait-and-see sentiment and develop clear, one-sided trading confidence than on financial news. $1.3500 is a key strong resistance level, while support below is quietly rising . From a technical perspective, three key price levels deserve close attention: The psychological level of $1.3500 remains a key resistance level. The exchange rate has repeatedly approached this point but has been rejected and fallen back, indicating a large amount of selling pressure and profit-taking near this price level, making a sustained upward move difficult. Even if the price briefly breaks through 1.3500, it does not represent a trend reversal; a truly effective bullish signal is a daily closing price that holds above 1.3500 and subsequently remains stable above this level. The $1.3435 level has formed a very strong key support in recent days. The importance of this level is not simply due to its chart position, but because significant buying support has appeared every time the price falls to this level, making it the most important defensive barrier for the bulls. GBP/USD hourly chart . (GBP/USD hourly chart source: FX168) The newly formed intraday support level is $1.3480, which held throughout the Asian session today. This level can be considered a short-term intraday support/resistance level, but its strength is far less than that of $1.3435. If the exchange rate holds above $1.3480, the price will remain in the upper half of the range; however, a break below this level would likely lead to a test of the $1.3435 area for the remainder of Monday's trading session, and even Tuesday and Wednesday. The highly influential US Consumer Price Index (CPI) data will be released on Wednesday, significantly impacting the exchange rate. Range-bound trading is prone to misjudgments. Traders often fall into the trap of concluding that an upward breakout is imminent simply because the support level is strengthening. A strengthening support level has two possibilities: either genuine buying demand is entering the market, or the market is generally in a wait-and-see mode, with neither bulls nor bears willing to open large positions. Even if the downside is limited, repeated failures to break through key resistance levels will gradually erode bullish confidence. Furthermore, traders often fall into a psychological trap: believing that narrow-range fluctuations signify an impending major market move. Sideways trading ranges can sometimes be a consolidation phase for a trending market, or simply the market awaiting significant data or news for a repricing. The difference often becomes clear only after the market has moved. Currently, the market is characterized by bulls actively accepting declines while bears continue to suppress rallies, indicating a stalemate between bulls and bears, with no clear winner yet. Two scenarios will fundamentally alter the current market interpretation: Optimistic Bullish Scenario Strong support levels are an early signal that the exchange rate is gradually stabilizing at higher levels. If GBP/USD continues to hold above 1.3480, and subsequently breaks through and stabilizes above 1.3500, the current repeated rallies and pullbacks will be defined as consolidation during an uptrend, rather than selling pressure from above. Short-selling pressure scenario Another weakening logic also holds true: if the exchange rate encounters strong resistance again at 1.3500 and subsequently breaks below 1.3480, it will completely weaken the bullish logic, and the strong support at 1.3435 will face a severe test. If the key support at 1.3435 is breached, it indicates that the recent bullish momentum is merely a temporary illusion and lacks sustainability. Subsequent price tests will verify the true strength of the bulls and bears . Currently, there is no clear one-sided trend; all market signals are hidden in the price's reaction to key levels. Whether 1.3480 can hold as the intraday low and whether 1.3500 will again suppress further gains—the repeated testing of these two price levels will reflect the true strength of market supply and demand more directly than a single candlestick. The market will provide a clear answer in the next few trading days: will the current rising support completely reverse the overall oscillating pattern, or will the resistance at 1.3500 continue to firmly limit upward movement?
- Risk Warning and Disclaimer
- The market involves risk, and trading may not be suitable for all investors. This article is for reference only and does not constitute personal investment advice, nor does it take into account certain users’ specific investment objectives, financial situation, or other needs. Any investment decisions made based on this information are at your own risk.