Gold is nearing a two-month high; the real variable that will determine its volatility this week is here.
2026-08-10 20:00:55
On Monday, August 10th, spot gold entered a consolidation phase at higher levels after a significant rebound last week. Currently trading around $4340 per ounce, intraday volatility is relatively limited. Last week saw a cumulative gain of over 7%, reaching a near seven-week high on Friday. Meanwhile, the unexpected decrease of 23,000 in US non-farm payrolls in July has led the market to reassess the Federal Reserve's future interest rate path, with the probability of a September rate hike falling from a previously high level to approximately 44%. This week, market attention has shifted to the US Consumer Price Index (CPI) and Producer Price Index (PPI), meaning that the core of gold's current pricing has shifted from a purely technical rebound to a new round of rebalancing between employment, inflation, and real interest rates. 
 More noteworthy is the MACD structure. The DIFF has risen to 33.67, the DEA is -6.42, and the MACD histogram has expanded to around 80.18. This doesn't simply mean a bullish signal, but rather that recent price movements are significantly faster than during previous consolidation phases, indicating a rapid release of short-term momentum. However, increased momentum and volatility risk often occur simultaneously. A breakout of the upper Bollinger Band shouldn't be mechanically interpreted as trend confirmation or overbought conditions. The Bollinger Bands truly reflect the price's position relative to its historical average and standard deviation. When the market suddenly breaks out of a prolonged narrow consolidation range, the rapid widening of the distance between the price and the middle band indicates that the market is undergoing a volatility repricing.
Employment data alters interest rate pricing, gold regains macroeconomic drivers.
The most significant change in this round of gold price movements stems from the repricing of interest rate expectations. July's US non-farm payrolls decreased by 23,000, significantly weaker than the market's previous expectation of an increase of approximately 80,000, and the employment data for the previous two months was also revised downwards. While employment data itself doesn't directly determine gold prices, it influences precious metal valuations through three channels: Federal Reserve policy expectations, US Treasury yields, and the US dollar. The latest market pricing shows that the probability of a September rate hike has fallen to approximately 44%, significantly lower than before the employment report was released. Gold itself does not generate interest; when the expectation of a risk-free interest rate rises, its opportunity cost of holding typically increases; conversely, when the market weakens expectations of further policy tightening, opportunity cost pressures decrease. Therefore, the recent rise in gold cannot be simply interpreted as increased safe-haven demand; a more accurate explanation is that the repricing of the interest rate path has reduced the valuation pressure previously borne by gold. The decline in US Treasury yields further reinforces this logic. The 10-year US Treasury yield is trading around 4.65%, lower than the recent high of approximately 4.74%; the US dollar index is near a two-month low. These simultaneous changes in both have created a more favorable pricing environment for gold in terms of financial conditions.Market focus is on this week's US inflation data.
The employment data completed the first phase of expectation revision, but this week's Consumer Price Index (CPI) and Producer Price Index (PPI) are the core variables for testing whether this repricing can be sustained. The market is currently not focused on a single inflation figure, but rather on whether inflation can signal a consistent trend with the slowdown in employment. The latest market expectations indicate that before the CPI release, investors were nearly evenly balanced on the probabilities of the Fed maintaining its policy unchanged in September and raising interest rates again. Some institutions predict that the overall inflation rate may be around 3.4%. If inflation continues to be sticky, the market may reassess the previously rapidly declining probability of policy tightening; if price pressures are weaker than expected, the interest rate reassessment triggered by the employment data will have more macroeconomic basis. Therefore, for gold, the biggest variable this week is not a so-called technical price level, but whether real interest rate expectations continue to change. The CPI influences the assessment of end-user inflation, while the PPI provides clues about cost-side pressures; both sets of data together determine how the market recalculates the length of time policy rates will remain high. This is also the biggest difference between the current gold market and a typical technical rebound. The simultaneous occurrence of rising prices, a weaker dollar, and a decline in US Treasury yields from their highs means that the recent precious metals market has embedded a more complex macroeconomic pricing process.The daily chart structure has clearly improved, but volatility has increased accordingly.
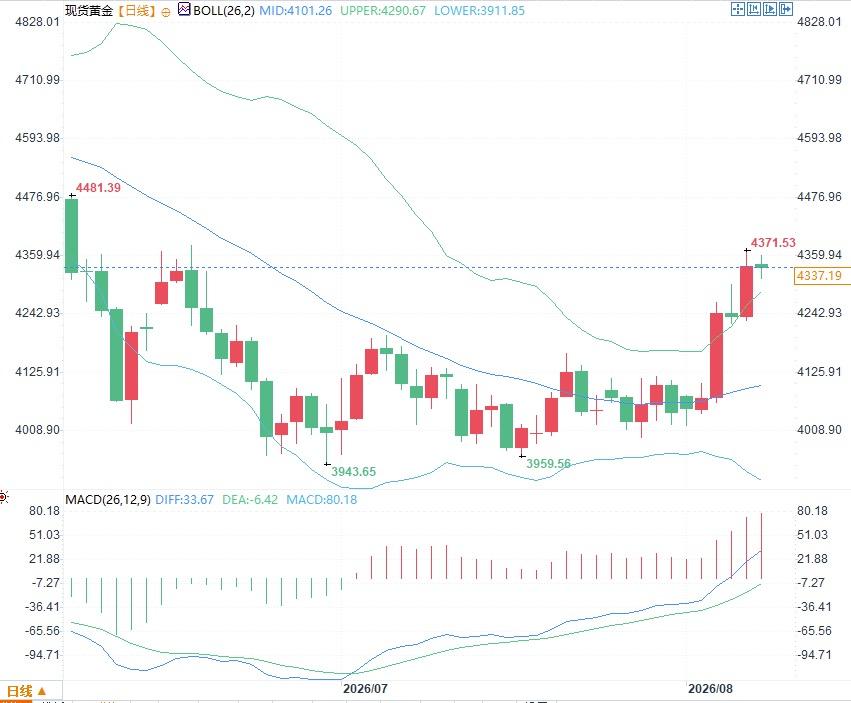
From a technical perspective, the daily chart shows that the Bollinger Bands for gold are as follows: the middle band is around 4101, the upper band is around 4291, and the lower band is around 3912. The price had previously been trading near or below the middle band for an extended period, but in recent trading days it has quickly broken out of this consolidation range and moved back above the middle band. The recent high reached around 4371, indicating that the market has shifted from a low-volatility consolidation to a higher-volatility state. More noteworthy is the MACD structure. The DIFF has risen to 33.67, the DEA is -6.42, and the MACD histogram has expanded to around 80.18. This doesn't simply mean a bullish signal, but rather that recent price movements are significantly faster than during previous consolidation phases, indicating a rapid release of short-term momentum. However, increased momentum and volatility risk often occur simultaneously. A breakout of the upper Bollinger Band shouldn't be mechanically interpreted as trend confirmation or overbought conditions. The Bollinger Bands truly reflect the price's position relative to its historical average and standard deviation. When the market suddenly breaks out of a prolonged narrow consolidation range, the rapid widening of the distance between the price and the middle band indicates that the market is undergoing a volatility repricing.
- Risk Warning and Disclaimer
- The market involves risk, and trading may not be suitable for all investors. This article is for reference only and does not constitute personal investment advice, nor does it take into account certain users’ specific investment objectives, financial situation, or other needs. Any investment decisions made based on this information are at your own risk.