The 10-year US Treasury yield is near 4.7%, while the US dollar is hovering around 100. What is the market pricing in?
2026-08-12 15:58:56
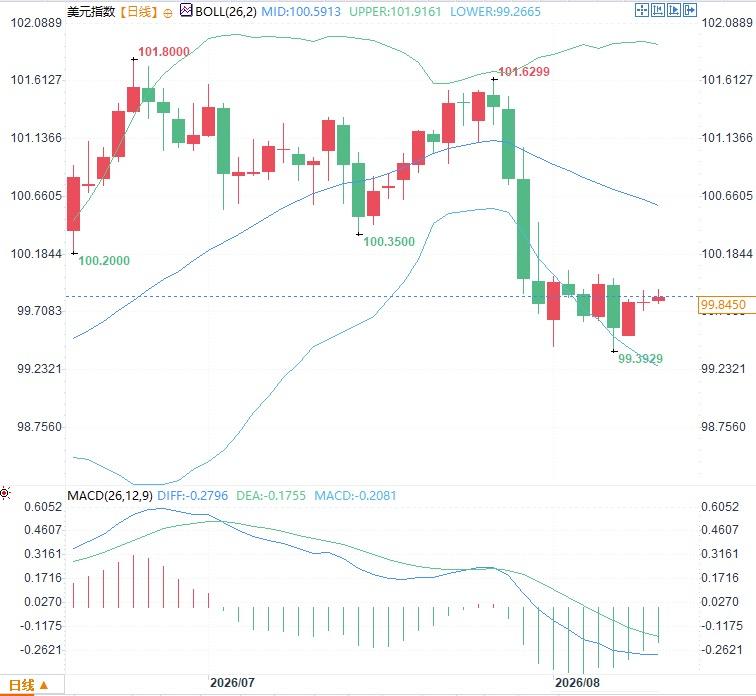
On Wednesday, August 12, the US dollar index hovered around 99.85, with limited intraday volatility. The unusual aspect of the current market is not merely the dollar index's pullback to near the 100 mark, but rather the changing monetary policy pricing mechanism.  Since taking office, Federal Reserve Chairman Kevin Warsh has reduced reliance on explicit forward guidance, forcing the market to place greater weight on economic data, term premiums, and its own information. Meanwhile, the US July Consumer Price Index will be released at 8:30 PM today. Before the latest data release, both the exchange rate and bond markets are in a phase of recalibrating policy paths. From a technical perspective, the US dollar index has recently fallen rapidly from around 101.63 and is currently trading around 99.8. The chart shows that the Bollinger Bands have a middle band of approximately 100.59, an upper band of approximately 101.92, and a lower band of approximately 99.27; the index has moved below the middle band and is approaching the lower band. The MACD DIFF is approximately -0.28, the DEA is approximately -0.18, and the histogram remains below the zero line. It is noteworthy that the price movement from around 101.63 to around 99.8 occurred during a phase of market reassessment of the Fed's policy communication methods; therefore, its implications extend beyond short-term exchange rate fluctuations.
  Kevin Warsh officially took office as Chairman of the Federal Reserve on May 22. On July 29, the Fed voted 9-3 to maintain the target range for the federal funds rate at 3.50% to 3.75%. This means that the current pricing of dollar assets is not facing a simple cycle of interest rate cuts or hikes, but rather an environment where policy rates, inflation risks, and term premiums all influence the market simultaneously. A key reason why Warsh's recent policy communications have attracted attention is that he has reduced the likelihood of the market locking in the policy path in advance through central bank language. The financial logic behind this approach is not complicated. When central banks consistently provide very clear interest rate paths, market participants gradually reduce the weight they place on their own information and focus more on the central bank's wording, forecasts, and policy hints. Over time, asset prices may reflect more of a prediction of central bank behavior than an independent judgment of economic fundamentals. The potential effect of reducing forward guidance is to allow interest rates to again include more economic information and risk premiums. In July, Warsh stated that the Fed's commitment to price stability and full employment remains unchanged, while emphasizing that the policy framework, analytical tools, and policy methods need to be re-examined. However, this communication model comes at a clear cost. With reduced forward guidance, uncertainty surrounding the policy path will increase, potentially widening the term premium in medium- and long-term interest rates, and leading to more fragmented interpretations of the same economic data. A noteworthy phenomenon is the lack of a mechanical one-to-one correspondence between the US dollar and US long-term Treasury yields. The 10-year US Treasury yield is around 4.7%, while the 30-year yield is above 5%. In contrast, the US dollar index remains around 100. This combination suggests that rising long-term yields cannot be simply interpreted as a shift in monetary policy expectations towards tightening. Long-term Treasury yields can be broken down into expectations of future short-term interest rates and the term premium. If investors demand higher term compensation, even a rise in long-term yields does not necessarily indicate a corresponding increase in market expectations for policy rates. This is a crucial context for the current performance of the US dollar index. When interest rate fluctuations stem more from the term premium than from future policy rates themselves, the dollar's sensitivity to changes in US Treasury yields may differ from traditional environments. Therefore, simply observing the absolute level of the 10-year yield is insufficient to explain all fluctuations in the US dollar index. US nonfarm payrolls fell by 23,000 in July, with the unemployment rate at 4.1%. Over the past 12 months, nonfarm payrolls have averaged an increase of approximately 34,000 per month. The employment data reflects a clear shift in the labor market from its previous period of rapid expansion. On the other hand, the Consumer Price Index (CPI) rose 3.5% year-on-year in June, with energy prices rising 15.7% year-on-year. This is precisely where the most significant changes in market mechanisms have occurred since the reduction in forward guidance. Previously, traders could often construct relatively continuous policy paths using central bank communications. Now, the same inflation or employment data needs to answer three questions simultaneously: how does it change policy rate expectations, how does it change term premiums, and whether it changes the market's perception of the credibility of the Federal Reserve's policies? The US dollar index is trading around the 100 area, so the apparent narrow range actually corresponds to a readjustment of the interest rate pricing mechanism.
Since taking office, Federal Reserve Chairman Kevin Warsh has reduced reliance on explicit forward guidance, forcing the market to place greater weight on economic data, term premiums, and its own information. Meanwhile, the US July Consumer Price Index will be released at 8:30 PM today. Before the latest data release, both the exchange rate and bond markets are in a phase of recalibrating policy paths. From a technical perspective, the US dollar index has recently fallen rapidly from around 101.63 and is currently trading around 99.8. The chart shows that the Bollinger Bands have a middle band of approximately 100.59, an upper band of approximately 101.92, and a lower band of approximately 99.27; the index has moved below the middle band and is approaching the lower band. The MACD DIFF is approximately -0.28, the DEA is approximately -0.18, and the histogram remains below the zero line. It is noteworthy that the price movement from around 101.63 to around 99.8 occurred during a phase of market reassessment of the Fed's policy communication methods; therefore, its implications extend beyond short-term exchange rate fluctuations. Kevin Warsh officially took office as Chairman of the Federal Reserve on May 22. On July 29, the Fed voted 9-3 to maintain the target range for the federal funds rate at 3.50% to 3.75%. This means that the current pricing of dollar assets is not facing a simple cycle of interest rate cuts or hikes, but rather an environment where policy rates, inflation risks, and term premiums all influence the market simultaneously. A key reason why Warsh's recent policy communications have attracted attention is that he has reduced the likelihood of the market locking in the policy path in advance through central bank language. The financial logic behind this approach is not complicated. When central banks consistently provide very clear interest rate paths, market participants gradually reduce the weight they place on their own information and focus more on the central bank's wording, forecasts, and policy hints. Over time, asset prices may reflect more of a prediction of central bank behavior than an independent judgment of economic fundamentals. The potential effect of reducing forward guidance is to allow interest rates to again include more economic information and risk premiums. In July, Warsh stated that the Fed's commitment to price stability and full employment remains unchanged, while emphasizing that the policy framework, analytical tools, and policy methods need to be re-examined. However, this communication model comes at a clear cost. With reduced forward guidance, uncertainty surrounding the policy path will increase, potentially widening the term premium in medium- and long-term interest rates, and leading to more fragmented interpretations of the same economic data. A noteworthy phenomenon is the lack of a mechanical one-to-one correspondence between the US dollar and US long-term Treasury yields. The 10-year US Treasury yield is around 4.7%, while the 30-year yield is above 5%. In contrast, the US dollar index remains around 100. This combination suggests that rising long-term yields cannot be simply interpreted as a shift in monetary policy expectations towards tightening. Long-term Treasury yields can be broken down into expectations of future short-term interest rates and the term premium. If investors demand higher term compensation, even a rise in long-term yields does not necessarily indicate a corresponding increase in market expectations for policy rates. This is a crucial context for the current performance of the US dollar index. When interest rate fluctuations stem more from the term premium than from future policy rates themselves, the dollar's sensitivity to changes in US Treasury yields may differ from traditional environments. Therefore, simply observing the absolute level of the 10-year yield is insufficient to explain all fluctuations in the US dollar index. US nonfarm payrolls fell by 23,000 in July, with the unemployment rate at 4.1%. Over the past 12 months, nonfarm payrolls have averaged an increase of approximately 34,000 per month. The employment data reflects a clear shift in the labor market from its previous period of rapid expansion. On the other hand, the Consumer Price Index (CPI) rose 3.5% year-on-year in June, with energy prices rising 15.7% year-on-year. This is precisely where the most significant changes in market mechanisms have occurred since the reduction in forward guidance. Previously, traders could often construct relatively continuous policy paths using central bank communications. Now, the same inflation or employment data needs to answer three questions simultaneously: how does it change policy rate expectations, how does it change term premiums, and whether it changes the market's perception of the credibility of the Federal Reserve's policies? The US dollar index is trading around the 100 area, so the apparent narrow range actually corresponds to a readjustment of the interest rate pricing mechanism.
- Risk Warning and Disclaimer
- The market involves risk, and trading may not be suitable for all investors. This article is for reference only and does not constitute personal investment advice, nor does it take into account certain users’ specific investment objectives, financial situation, or other needs. Any investment decisions made based on this information are at your own risk.