Gold prices continued their volatile rebound as expectations for a Fed rate hike slowed, awaiting a breakout from their trading range.
2026-08-17 09:52:56
Spot gold continued its rebound in early Asian trading on Monday, rising to around $4,400 per ounce at one point. Previously, gold had seen alternating periods of gains and pullbacks following the release of inflation data. The latest US retail sales data further reinforced market expectations of slowing economic growth and a shift in Federal Reserve policy, while a weaker dollar provided additional support for dollar-denominated gold.  US retail sales fell 0.6% month-over-month in July, lower than the revised 0.2% increase in June and significantly weaker than the market's previous expectation of around 0.1%. This is a significant signal of a marked reversal in the continuous growth trend of retail sales. Year-over-year, July retail sales still grew by 5.0%, indicating that US consumption has not experienced a complete slowdown. However, the sudden weakening of the month-over-month data has led investors to reassess the sustainability of consumer spending in the second half of the year. Core retail sales also declined, further increasing market focus on the economic growth momentum in the third quarter. However, the decline in July retail sales does not necessarily mean that US consumer demand has entered a sustained contraction phase. Part of the decline is related to lower gasoline prices, weaker car sales, and changes in the timing of large online promotional events. Therefore, the single-month data still needs to be considered in conjunction with subsequent employment, income, and service consumption data. Market surveys show that some discretionary consumption sectors remain resilient, and service consumption such as dining out continues to grow, meaning that the US economy is currently closer to a "slowdown in growth" rather than a "consumption recession." What truly changes the pricing logic of the gold market is the combined signal from recent inflation and consumption data. US CPI rose only 0.1% month-on-month in July, with the year-on-year growth rate slowing to 3.4% from 3.5% in June, and core CPI falling to 2.5% year-on-year. Meanwhile, PPI remained flat month-on-month in July, significantly lower than the market's previous expectations. The lack of renewed signs of sustained inflation, coupled with a temporary cooling in consumption, has further reduced market concerns about the Federal Reserve continuing to tighten policy in the near term. Changes in interest rate expectations directly affect the opportunity cost of gold. Since gold itself does not generate interest income, the opportunity cost of holding gold relative to dollar assets typically increases when the market expects policy rates to remain high or even rise further; conversely, if expectations of rate hikes decline, real interest rates and the dollar are suppressed, increasing the relative attractiveness of gold. Currently, market bets on a September Fed rate hike are significantly lower than before, with market surveys showing a probability of around 30%, indicating that the mainstream market view is gradually shifting from "continued rate hikes" to "a pause in rate hikes." At the same time, the gold market's own liquidity situation is also showing positive changes. Gold previously experienced a significant profit-taking pullback, but recent buying activity in gold ETFs indicates that some institutional investors are using the price correction to rebuild long positions. Some large gold ETFs have seen inflows recently, while global central bank gold demand remains resilient, providing fundamental support for gold prices in the medium term. From a global market perspective, gold is currently influenced by four factors simultaneously: the US dollar, US Treasury yields, real interest rates, and safe-haven demand. If US economic data continues to signal a cooling trend, and expectations for a Fed rate hike further decline, the US dollar index and US Treasury yields may come under pressure, potentially allowing gold further upside. Conversely, if subsequent employment, service sector activity, or inflation show renewed resilience, and the market re-increases the probability of a rate hike, gold's previous gains may face profit-taking. Geopolitical tensions remain another variable that gold bulls need to monitor. Recent tensions in the Middle East and uncertainties surrounding key shipping routes have not completely subsided. If energy supplies or international shipping are further disrupted, safe-haven funds may flow back into gold. However, if the situation eases substantially, gold's safe-haven premium may decline in stages. Therefore, this factor is more likely to act as a short-term amplifier rather than the sole driver determining gold's medium-term trend. Overall, the current gold market has formed a relatively clear logical chain: moderate US inflation → cooling consumer data → decreased expectations of Fed rate hikes → reduced pressure on the dollar and interest rates → increased attractiveness of gold allocation. However, the market has already priced in rate cuts or a halt to rate hikes, so whether gold can further break through previous highs still depends on whether new economic data can continue to validate this policy expectation. From a daily chart perspective, spot gold has now regained its position above the 100-day moving average near $4380 and remains above the 20-day Bollinger Band middle line, with the overall trend structure still biased towards the bulls. Previously, gold rose to a two-month high driven by inflation data before experiencing a rapid pullback, but the correction did not break the main upward structure, indicating that there is still significant support below. The daily relative strength index (RSI) was previously around 64, entering a bullish zone, but has not yet reached a typical severely overbought level, so the bulls still have room to test the upper resistance. The first resistance level to watch is around $4480, which also corresponds to the upper Bollinger Band and is a crucial technical area that gold must overcome for further breakthroughs. A successful break above $4480 could open up further upside potential towards previous highs; however, if multiple attempts fail to break through, increased profit-taking at higher levels should be anticipated. The first short-term support level is around $4385, which not only serves as a moving average support but also forms a relatively direct dividing line between bullish and bearish sentiment. A break below this level would see the next support around the middle Bollinger Band at $4195; if the medium-term trend weakens further, the area around $3905 would become a significant defensive zone. On the 4-hour chart, gold remains in a short-term rebound structure, with the price approaching $4400 again, indicating that buyers are attempting to correct the previous rapid pullback. Short-term momentum is currently bullish, but given that the price is approaching a previous area of dense trading, further upward movement requires the support of both the US dollar and US Treasury yields. If the price can stabilize above $4380 on the 4-hour chart and further break through $4480, the short-term trend may shift from a rebound to a new round of upward movement. However, if it breaks below $4380 after a surge, it's more likely to develop into a high-level consolidation phase, seeking new support around $4200. In terms of trading rhythm, it's not advisable to simply chase the price upwards at this time; instead, focus should be placed on the relationship between breakout confirmation and pullback support levels.
 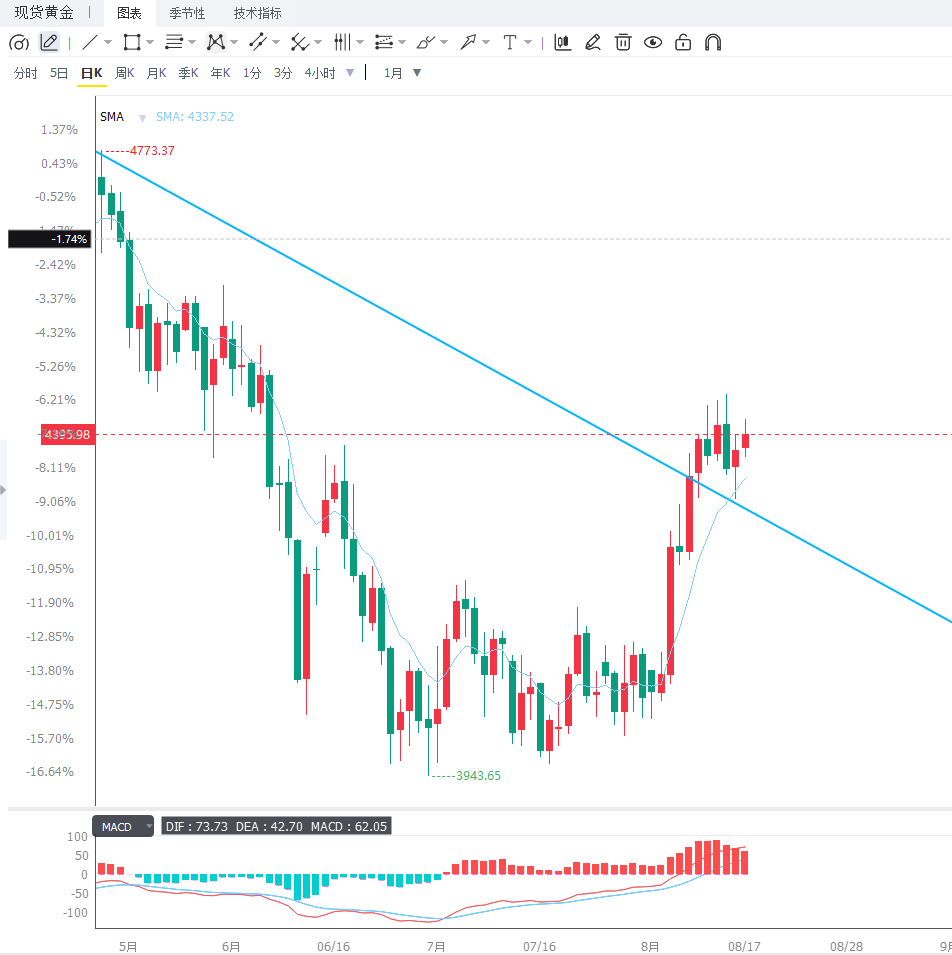 Editor's Summary: Gold's current core support stems from cooling US inflation, weakening retail sales, and declining expectations of a Fed rate hike. The return of ETF funds further improves the medium-term demand environment. Until there is a significant reversal in fundamentals, gold will generally maintain a bullish trend. However, the market has already priced in a considerable portion of policy expectations, and gold has accumulated some profit-taking after rebounding from its lows, so further short-term gains are not without resistance. $4480 is a key level that the bulls must break through in the next phase, while $4380 is an important support level to determine whether the current upward structure can continue. If US economic data continues to cool, the dollar weakens, and US Treasury real yields decline, gold still has further upside potential; conversely, if inflation rises again or the Fed releases a more hawkish signal, a deeper technical correction in gold should be anticipated.
US retail sales fell 0.6% month-over-month in July, lower than the revised 0.2% increase in June and significantly weaker than the market's previous expectation of around 0.1%. This is a significant signal of a marked reversal in the continuous growth trend of retail sales. Year-over-year, July retail sales still grew by 5.0%, indicating that US consumption has not experienced a complete slowdown. However, the sudden weakening of the month-over-month data has led investors to reassess the sustainability of consumer spending in the second half of the year. Core retail sales also declined, further increasing market focus on the economic growth momentum in the third quarter. However, the decline in July retail sales does not necessarily mean that US consumer demand has entered a sustained contraction phase. Part of the decline is related to lower gasoline prices, weaker car sales, and changes in the timing of large online promotional events. Therefore, the single-month data still needs to be considered in conjunction with subsequent employment, income, and service consumption data. Market surveys show that some discretionary consumption sectors remain resilient, and service consumption such as dining out continues to grow, meaning that the US economy is currently closer to a "slowdown in growth" rather than a "consumption recession." What truly changes the pricing logic of the gold market is the combined signal from recent inflation and consumption data. US CPI rose only 0.1% month-on-month in July, with the year-on-year growth rate slowing to 3.4% from 3.5% in June, and core CPI falling to 2.5% year-on-year. Meanwhile, PPI remained flat month-on-month in July, significantly lower than the market's previous expectations. The lack of renewed signs of sustained inflation, coupled with a temporary cooling in consumption, has further reduced market concerns about the Federal Reserve continuing to tighten policy in the near term. Changes in interest rate expectations directly affect the opportunity cost of gold. Since gold itself does not generate interest income, the opportunity cost of holding gold relative to dollar assets typically increases when the market expects policy rates to remain high or even rise further; conversely, if expectations of rate hikes decline, real interest rates and the dollar are suppressed, increasing the relative attractiveness of gold. Currently, market bets on a September Fed rate hike are significantly lower than before, with market surveys showing a probability of around 30%, indicating that the mainstream market view is gradually shifting from "continued rate hikes" to "a pause in rate hikes." At the same time, the gold market's own liquidity situation is also showing positive changes. Gold previously experienced a significant profit-taking pullback, but recent buying activity in gold ETFs indicates that some institutional investors are using the price correction to rebuild long positions. Some large gold ETFs have seen inflows recently, while global central bank gold demand remains resilient, providing fundamental support for gold prices in the medium term. From a global market perspective, gold is currently influenced by four factors simultaneously: the US dollar, US Treasury yields, real interest rates, and safe-haven demand. If US economic data continues to signal a cooling trend, and expectations for a Fed rate hike further decline, the US dollar index and US Treasury yields may come under pressure, potentially allowing gold further upside. Conversely, if subsequent employment, service sector activity, or inflation show renewed resilience, and the market re-increases the probability of a rate hike, gold's previous gains may face profit-taking. Geopolitical tensions remain another variable that gold bulls need to monitor. Recent tensions in the Middle East and uncertainties surrounding key shipping routes have not completely subsided. If energy supplies or international shipping are further disrupted, safe-haven funds may flow back into gold. However, if the situation eases substantially, gold's safe-haven premium may decline in stages. Therefore, this factor is more likely to act as a short-term amplifier rather than the sole driver determining gold's medium-term trend. Overall, the current gold market has formed a relatively clear logical chain: moderate US inflation → cooling consumer data → decreased expectations of Fed rate hikes → reduced pressure on the dollar and interest rates → increased attractiveness of gold allocation. However, the market has already priced in rate cuts or a halt to rate hikes, so whether gold can further break through previous highs still depends on whether new economic data can continue to validate this policy expectation. From a daily chart perspective, spot gold has now regained its position above the 100-day moving average near $4380 and remains above the 20-day Bollinger Band middle line, with the overall trend structure still biased towards the bulls. Previously, gold rose to a two-month high driven by inflation data before experiencing a rapid pullback, but the correction did not break the main upward structure, indicating that there is still significant support below. The daily relative strength index (RSI) was previously around 64, entering a bullish zone, but has not yet reached a typical severely overbought level, so the bulls still have room to test the upper resistance. The first resistance level to watch is around $4480, which also corresponds to the upper Bollinger Band and is a crucial technical area that gold must overcome for further breakthroughs. A successful break above $4480 could open up further upside potential towards previous highs; however, if multiple attempts fail to break through, increased profit-taking at higher levels should be anticipated. The first short-term support level is around $4385, which not only serves as a moving average support but also forms a relatively direct dividing line between bullish and bearish sentiment. A break below this level would see the next support around the middle Bollinger Band at $4195; if the medium-term trend weakens further, the area around $3905 would become a significant defensive zone. On the 4-hour chart, gold remains in a short-term rebound structure, with the price approaching $4400 again, indicating that buyers are attempting to correct the previous rapid pullback. Short-term momentum is currently bullish, but given that the price is approaching a previous area of dense trading, further upward movement requires the support of both the US dollar and US Treasury yields. If the price can stabilize above $4380 on the 4-hour chart and further break through $4480, the short-term trend may shift from a rebound to a new round of upward movement. However, if it breaks below $4380 after a surge, it's more likely to develop into a high-level consolidation phase, seeking new support around $4200. In terms of trading rhythm, it's not advisable to simply chase the price upwards at this time; instead, focus should be placed on the relationship between breakout confirmation and pullback support levels. Editor's Summary: Gold's current core support stems from cooling US inflation, weakening retail sales, and declining expectations of a Fed rate hike. The return of ETF funds further improves the medium-term demand environment. Until there is a significant reversal in fundamentals, gold will generally maintain a bullish trend. However, the market has already priced in a considerable portion of policy expectations, and gold has accumulated some profit-taking after rebounding from its lows, so further short-term gains are not without resistance. $4480 is a key level that the bulls must break through in the next phase, while $4380 is an important support level to determine whether the current upward structure can continue. If US economic data continues to cool, the dollar weakens, and US Treasury real yields decline, gold still has further upside potential; conversely, if inflation rises again or the Fed releases a more hawkish signal, a deeper technical correction in gold should be anticipated.
- Risk Warning and Disclaimer
- The market involves risk, and trading may not be suitable for all investors. This article is for reference only and does not constitute personal investment advice, nor does it take into account certain users’ specific investment objectives, financial situation, or other needs. Any investment decisions made based on this information are at your own risk.