A chart showing support and resistance levels for commodities: Gold, Silver, Oil & Gas, Platinum, Palladium, Copper, and agricultural futures (August 19, 2026)
2026-08-19 07:18:57
A chart showing support and resistance levels for commodities: Gold, Silver, Oil & Gas, Platinum, Palladium, Copper, and Agricultural Commodities Futures, updated on Wednesday, August 19, 2026 at 07:10. It covers 14 commodities including gold, silver, platinum, palladium, copper, crude oil, natural gas, fuel oil, wheat, corn, and cotton. For more details, please see the chart specially created by FX678. 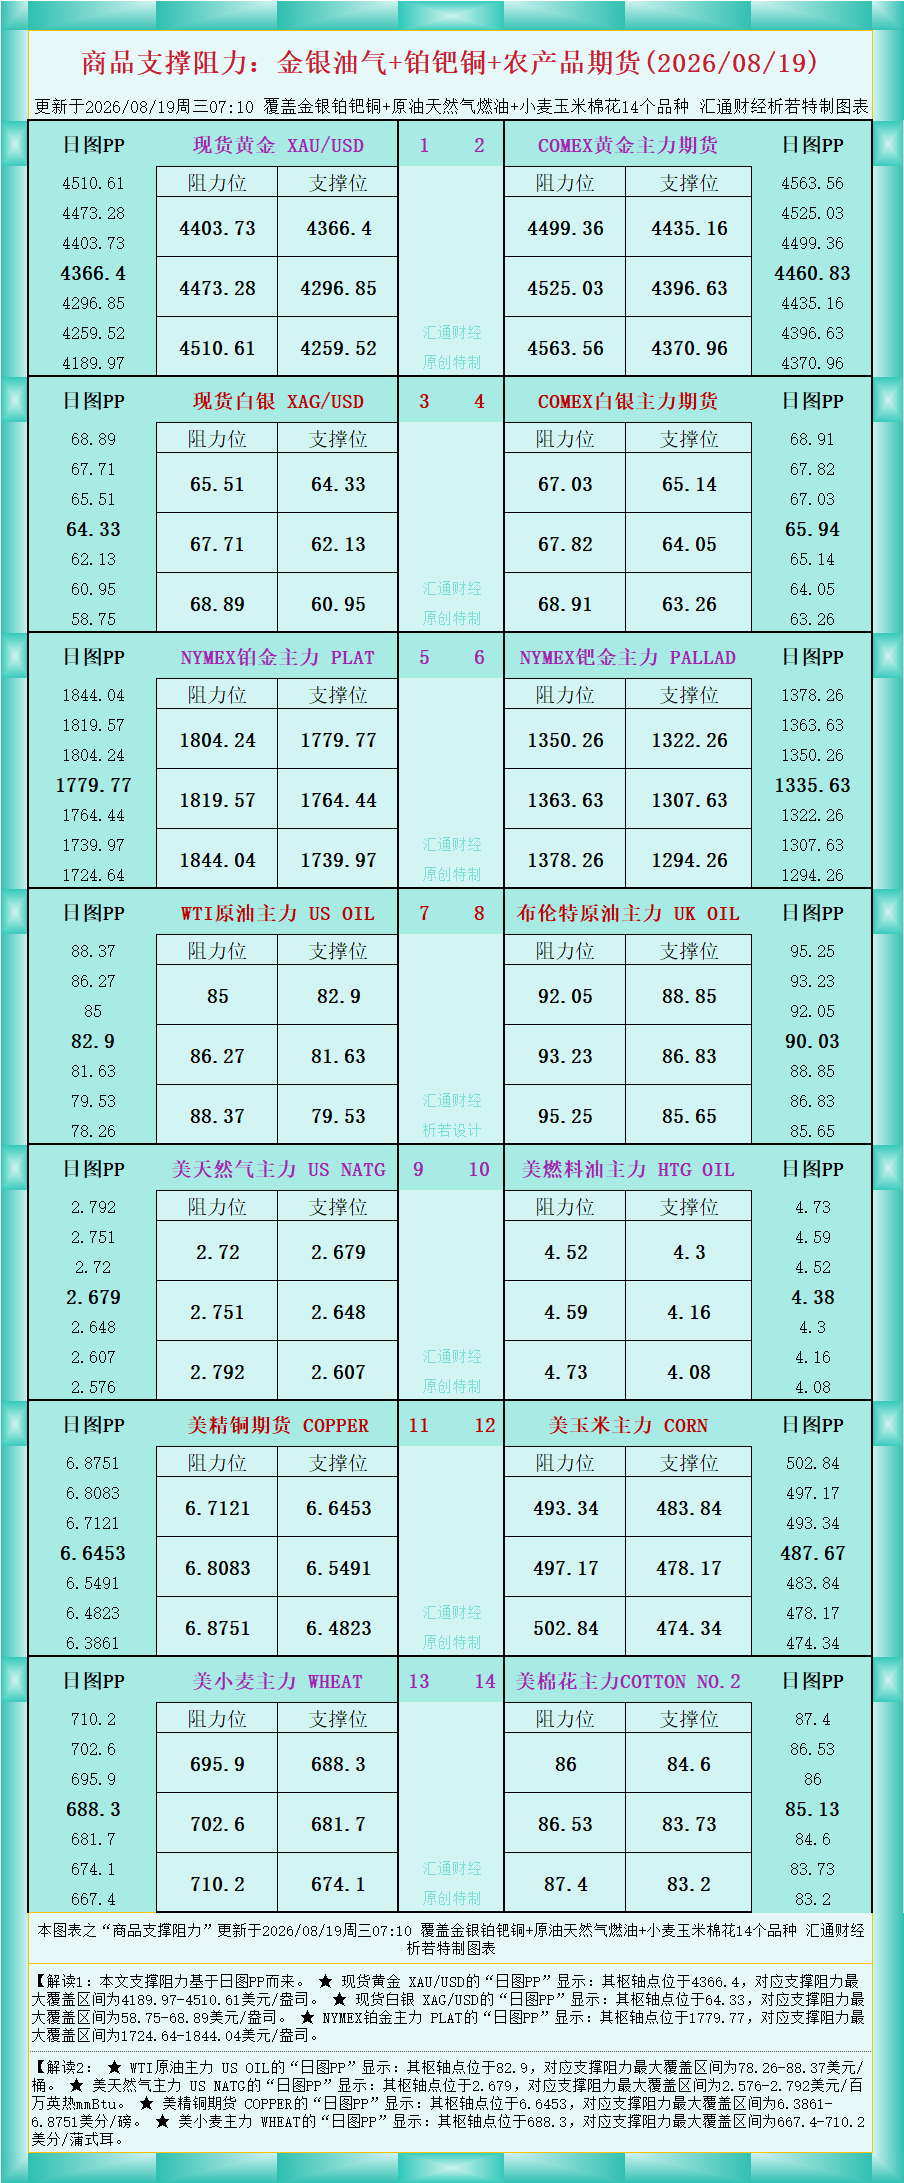 As shown in the chart, Interpretation 1: The support and resistance levels in this article are based on the daily chart's pivot point (PP). ★ The daily PP chart for spot gold (XAU/USD) shows that its pivot point is at 4366.4, corresponding to a maximum support and resistance range of $4189.97-$4510.61 per ounce. ★ The daily PP chart for spot silver (XAG/USD) shows that its pivot point is at 64.33, corresponding to a maximum support and resistance range of $58.75-$68.89 per ounce. ★ The daily PP chart for NYMEX platinum (PLA) shows that its pivot point is at 1779.77, corresponding to a maximum support and resistance range of $1724.64-$1844.04 per ounce. Interpretation 2: ★ The daily PP chart for WTI crude oil (US OIL) shows that its pivot point is at 82.9, corresponding to a maximum support and resistance range of $78.26-$88.37 per barrel. ★ The daily chart (PP) for US natural gas futures (US NATG) shows a pivot point at 2.679, with a maximum support/resistance range of $2.576-2.792 per million British thermal units (MMBtu). ★ The daily chart (PP) for US copper futures (COPPER) shows a pivot point at 6.6453, with a maximum support/resistance range of 6.3861-6.8751 cents per pound. ★ The daily chart (PP) for US wheat futures (WHEAT) shows a pivot point at 688.3, with a maximum support/resistance range of 667.4-710.2 cents per bushel. See charts for more detailed analysis of other commodities. Original content by FX678, all rights reserved, for reference only.
As shown in the chart, Interpretation 1: The support and resistance levels in this article are based on the daily chart's pivot point (PP). ★ The daily PP chart for spot gold (XAU/USD) shows that its pivot point is at 4366.4, corresponding to a maximum support and resistance range of $4189.97-$4510.61 per ounce. ★ The daily PP chart for spot silver (XAG/USD) shows that its pivot point is at 64.33, corresponding to a maximum support and resistance range of $58.75-$68.89 per ounce. ★ The daily PP chart for NYMEX platinum (PLA) shows that its pivot point is at 1779.77, corresponding to a maximum support and resistance range of $1724.64-$1844.04 per ounce. Interpretation 2: ★ The daily PP chart for WTI crude oil (US OIL) shows that its pivot point is at 82.9, corresponding to a maximum support and resistance range of $78.26-$88.37 per barrel. ★ The daily chart (PP) for US natural gas futures (US NATG) shows a pivot point at 2.679, with a maximum support/resistance range of $2.576-2.792 per million British thermal units (MMBtu). ★ The daily chart (PP) for US copper futures (COPPER) shows a pivot point at 6.6453, with a maximum support/resistance range of 6.3861-6.8751 cents per pound. ★ The daily chart (PP) for US wheat futures (WHEAT) shows a pivot point at 688.3, with a maximum support/resistance range of 667.4-710.2 cents per bushel. See charts for more detailed analysis of other commodities. Original content by FX678, all rights reserved, for reference only.- Risk Warning and Disclaimer
- The market involves risk, and trading may not be suitable for all investors. This article is for reference only and does not constitute personal investment advice, nor does it take into account certain users’ specific investment objectives, financial situation, or other needs. Any investment decisions made based on this information are at your own risk.