The New Zealand dollar is targeting 0.60 against the US dollar; the technical outlook is bullish, but the RSI has already flashed an overbought warning.
2026-08-24 14:03:03
The New Zealand dollar (NZD) entered a bullish consolidation phase against the US dollar at the start of the new week, hovering around 0.5975 in Asian trading, just shy of the new high since June reached last Friday (August 21). Although the latest New Zealand retail sales data cast a shadow over the NZD, the overall weakening US dollar continued to support the pair. Can this rally, ignited by a key breakout last Friday, break through the 0.60 level? What signals are emerging from the technical indicators?
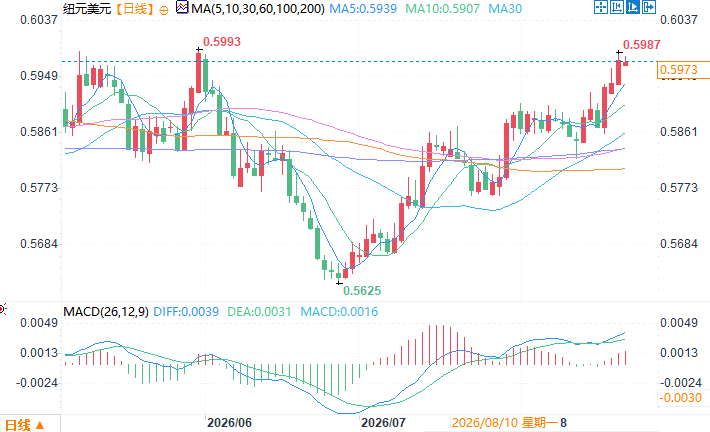 The New Zealand dollar/US dollar daily chart is sourced from EasyTrade. At 14:00 Beijing time on August 24, the New Zealand dollar was trading at 0.5973/74 against the US dollar.
The 0.59 level has been broken, giving the bulls a new entry ticket.
Last Friday, the New Zealand dollar successfully broke through the 0.5900 level against the US dollar, which the market saw as the trigger for a new round of bullish movement. Previously, the 0.59 level had repeatedly suppressed the exchange rate, but now it has become support, essentially giving the bulls a ticket to continue their upward push. Even more reassuring for the bulls is that the current exchange rate is firmly above the 200-period simple moving average (SMA). This moving average, located at 0.5845, is a watershed for the short-term trend. A price above it indicates that medium-term buying power is dominant; a break below it could signify the end of the upward trend. Furthermore, the MACD (Moving Average Convergence Divergence) remains in positive territory, indicating that upward momentum has not yet subsided, and the short-term bullish tone for this currency pair has been largely established.RSI approaches 69, overbought alert sounded.
However, there are also concerns amidst the optimism. The Relative Strength Index (RSI) is currently approaching 69, indicating quite strong buying pressure. An RSI above 50 signifies bullish dominance, while approaching 70 suggests the market is overheated. In layman's terms, the New Zealand dollar is like a sports car with the accelerator floored; it's fast, but the engine temperature is also soaring, and continuing to accelerate could lead to overheating. It's important to note that the RSI entering overbought territory doesn't necessarily mean an immediate reversal of the upward trend. More often, it suggests a potential slowdown in the upward momentum, meaning the exchange rate may enter a period of consolidation at higher levels, or a shallow pullback to digest the overheated indicator. In other words, the risk of chasing the rally in the short term is increasing, but the trend itself hasn't yet shown signs of reversal.Downward defense line: 0.59 is the first line of defense.
If the exchange rate retraces, there are several layers of support below. The first line of defense is the 0.5900 level, which was just broken. This level has gone from being the ceiling to the floor, and considerable buying is expected to be present. If this level is broken, the next key support is at 0.5845, where the 200-period SMA is located. This is also the last line of defense for the short-term trend. As long as this level holds, the overall constructive structure will not be broken, and the bulls still have a chance to make a comeback. However, if the exchange rate effectively breaks below 0.5845, it means that the short-term bullish outlook has been negated, and a meaningful correction may begin.Upside target: The 0.60 level is within reach.
Conversely, if the bulls can maintain their offensive, the psychological level of 0.6000 will be the next hurdle to overcome. This round number often attracts significant selling pressure, making it a battleground for both bulls and bears. However, considering the current price is around 0.5975, 0.60 seems within reach. But technical analysts generally believe that with the RSI already overbought, the price may need to undergo a period of consolidation at higher levels or a slight pullback to digest the overheated indicators before it can confidently break through 0.60. Once it effectively holds above 0.60, the strong rally that started from the year's low of around 0.5625 reached in June is expected to continue.Conclusion
Overall, the NZD/USD pair currently exhibits a clear bullish technical outlook. Friday's break above 0.5900 opened up further upside potential, with the psychological level of 0.60 within reach. However, the RSI approaching the overbought zone of 69 cautions investors against blindly chasing the price higher in the short term; consolidation is likely. The 200-period moving average at 0.5845 is a crucial support level for the bulls, while 0.6000 is the true test of whether the price can rise further. At this critical juncture in the battle between bulls and bears, patiently waiting for a clearer direction may be the wiser choice. The New Zealand dollar/US dollar daily chart is sourced from EasyTrade. At 14:00 Beijing time on August 24, the New Zealand dollar was trading at 0.5973/74 against the US dollar.
- Risk Warning and Disclaimer
- The market involves risk, and trading may not be suitable for all investors. This article is for reference only and does not constitute personal investment advice, nor does it take into account certain users’ specific investment objectives, financial situation, or other needs. Any investment decisions made based on this information are at your own risk.