Is the AI construction boom driving up bond yields?
2026-08-28 01:41:01
Over the past few years, long-term government bond yields in most G10 countries have continued to rise. Rising yields have put immense pressure on governments, as debt levels have increased significantly compared to a decade ago; even a slight increase in yields leads to a substantial increase in interest payments. In fact, the US Treasury's issuance of long-term bonds last week exceeded market expectations, surprising many. Many, including myself, believe this move was intended to artificially suppress yields. This directly led to a sharp decline in the US dollar, and "dollar devaluation trading" became prevalent. The market is well aware of the strategies employed by highly indebted countries, and therefore has rushed to purchase safe-haven assets to hedge against the rising risk of debt monetization. Regarding the causes of rising long-term yields, there are two opposing views in the market. The first view is that the surge in artificial intelligence construction is driving up yields—many companies are vying for financing, but the total amount of financing available is limited. This explanation is quite popular in Washington because it can divert public attention from another explanation: the real culprit behind rising long-term yields is the huge fiscal deficit. This article will analyze these two opposing views based on US savings and investment balance data. All the data strongly suggest that the rise in yields is due to the fiscal deficit, rather than the wave of artificial intelligence construction. 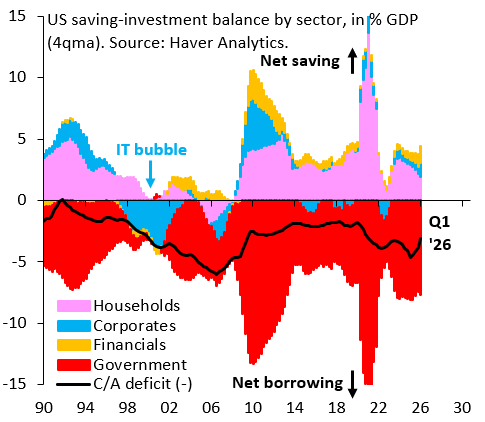 (Chart Explanation: The chart above shows quarterly savings-investment balance data for the United States since 1990. This identity breaks down the current account balance (black curve) into net savings in each sector of the economy. The household sector (pink bar) is typically a net saver, i.e., a capital supplier; the financial sector (orange bar) and the non-financial corporate sector (blue bar) are also net savers. The government sector (red bar) is generally a net borrower, i.e., absorbing net savings from other sectors of the economy through bond issuance.) The last round of technological innovation and productivity growth that triggered a market frenzy occurred during the dot-com bubble in the early 21st century. At that time, non-financial corporations shifted from being net savers to borrowers, and large-scale capital expenditures almost dominated the entire current account deficit in those years. However, a similar situation has not occurred now. Currently, the government is consuming social resources through negative savings, i.e., fiscal deficits; data as of the first quarter of this year shows that the non-financial corporate sector remains a net saver. Ultimately, the rise in government bond yields is not due to the artificial intelligence construction boom. What is pushing up yields is the traditional fiscal crowding-out effect and out-of-control fiscal policy.
(Chart Explanation: The chart above shows quarterly savings-investment balance data for the United States since 1990. This identity breaks down the current account balance (black curve) into net savings in each sector of the economy. The household sector (pink bar) is typically a net saver, i.e., a capital supplier; the financial sector (orange bar) and the non-financial corporate sector (blue bar) are also net savers. The government sector (red bar) is generally a net borrower, i.e., absorbing net savings from other sectors of the economy through bond issuance.) The last round of technological innovation and productivity growth that triggered a market frenzy occurred during the dot-com bubble in the early 21st century. At that time, non-financial corporations shifted from being net savers to borrowers, and large-scale capital expenditures almost dominated the entire current account deficit in those years. However, a similar situation has not occurred now. Currently, the government is consuming social resources through negative savings, i.e., fiscal deficits; data as of the first quarter of this year shows that the non-financial corporate sector remains a net saver. Ultimately, the rise in government bond yields is not due to the artificial intelligence construction boom. What is pushing up yields is the traditional fiscal crowding-out effect and out-of-control fiscal policy.
- Risk Warning and Disclaimer
- The market involves risk, and trading may not be suitable for all investors. This article is for reference only and does not constitute personal investment advice, nor does it take into account certain users’ specific investment objectives, financial situation, or other needs. Any investment decisions made based on this information are at your own risk.