With the 10-year US Treasury yield hovering around the 4.8% mark and oil prices surging, both the bond and oil markets have entered a critical observation window.
2026-09-09 13:42:06
This week, global financial markets are facing a crucial macroeconomic window. Long-term US Treasury yields surged again, with the 10-year yield repeatedly returning above 4.8%. US Treasury yields are a core anchor for global asset pricing, directly impacting the costs of various loans, including mortgages and auto loans. Meanwhile, the escalating conflict in the Middle East is driving up oil prices. Markets are holding their breath awaiting the US August PPI and CPI data, to be released by the US Bureau of Labor Statistics at 8:30 PM Beijing time on Thursday and Friday, respectively. These figures will directly determine the policy direction of the Federal Reserve's interest rate meeting next week, causing fluctuations in the bond, oil, and foreign exchange markets. 

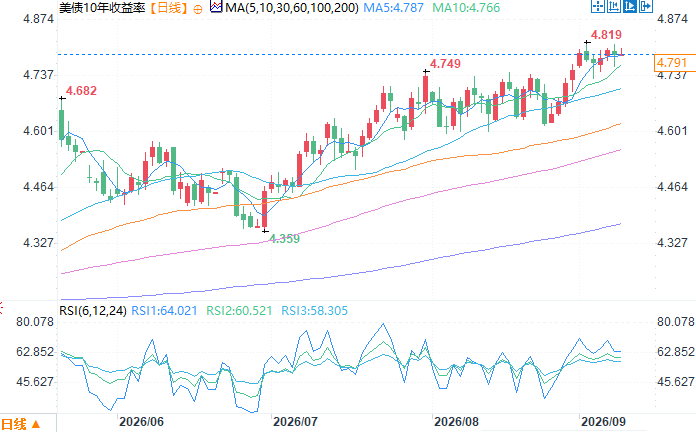 10-year US Treasury yield daily chart. Source: EasyTrade. At 13:40 Beijing time on September 9th, the 10-year US Treasury yield was 4.791%.
Yields on US Treasury bonds are diverging across maturities, with longer-term bonds showing greater geopolitical sensitivity.
The 10-year US Treasury yield, a cornerstone of global asset pricing, fluctuated repeatedly around the key 4.8% level during the past two trading days. Historically, on September 2nd, this yield surged to 4.819%, the highest level since November 2023. The price movement of 30-year ultra-long-term bonds is often more susceptible to geopolitical events, with the yield remaining flat at 5.239% on that day. The 2-year US Treasury yield, however, is more sensitive to adjustments in the Federal Reserve's short-term interest rates, rising by more than 1 basis point to close at 4.396%. In the basic concept of the US Treasury market, 1 basis point equals 0.01%, and bond yields and bond prices move inversely; a rise in yields means a fall in bond prices. The divergence in the performance of US Treasury bonds across different maturities reflects a difference in market pricing of short-term monetary policy and long-term geopolitical risks. Short-term 2-year bonds are more driven by expectations of Fed rate hikes, while 30-year ultra-long-term bonds are traded with a focus on long-term inflation, fiscal pressure, and global geopolitical situations.The rapid rise in oil prices adds uncertainty to the upcoming inflation data.
Behind the bond market volatility, rising oil prices were a major driver. On Tuesday, escalating tensions in the Middle East kept Brent crude futures fluctuating around $99 per barrel, while West Texas Intermediate (WTI) crude futures remained above $94 per barrel. The sharp rise in oil prices occurred just before the release of the US August PPI and CPI data. Investors hoped to glean insights into the Federal Reserve's future interest rate path from these two inflation reports. Market data provider FactSet's consensus forecast indicated that the August PPI was expected to rise by 5.4% year-on-year, compared to the previous data showing a 4.7% year-on-year increase in wholesale costs of goods and services. The August CPI was expected to rise by 3.3% year-on-year, a slight decrease from the previous value of 3.4%. Oil is a crucial component of the inflation system; higher energy prices push up overall price levels. If inflation data is higher than expected, the likelihood of the Federal Reserve maintaining a hawkish stance or even raising interest rates will further increase, and US Treasury yields will continue to face upward pressure.Non-farm payroll data fuels expectations of an interest rate hike, with the market betting on a nearly 60% probability of a rate hike next week.
The outlook for monetary policy has now become the market's primary focus. The significantly better-than-expected August non-farm payroll data has led more investors to believe that the Federal Reserve will initiate an interest rate hike at its policy meeting next week. According to the latest pricing of the CME FedWatch Tool, the market sees a 59% probability of a 25 basis point rate hike by the Fed. If inflation data continues to show resilience, this probability could rise further. Once the Fed raises rates, short-term US Treasury yields are likely to continue rising, the dollar will strengthen, and assets such as precious metals and stocks will face pressure. Conversely, if inflation cools significantly, the market will lower its expectations for rate hikes, US Treasury yields are expected to fall, and pressure on risk assets will be alleviated.Conclusion
In summary, the market is currently in a sensitive period with multiple intertwined variables. The 10-year US Treasury yield is hovering around the 4.8% mark, and the Middle East situation is pushing up oil prices. The inflation data will be a watershed moment in determining the future market direction. August's non-farm payrolls have already strengthened expectations of an interest rate hike, and PPI and CPI will verify the sustainability of inflation. Investors need to pay close attention to inflation readings; if inflation stickiness exceeds expectations, US Treasury yields may have further room to rise, and volatility in global asset classes will further amplify. 10-year US Treasury yield daily chart. Source: EasyTrade. At 13:40 Beijing time on September 9th, the 10-year US Treasury yield was 4.791%.
- Risk Warning and Disclaimer
- The market involves risk, and trading may not be suitable for all investors. This article is for reference only and does not constitute personal investment advice, nor does it take into account certain users’ specific investment objectives, financial situation, or other needs. Any investment decisions made based on this information are at your own risk.