The US dollar index rose due to expectations of a Federal Reserve rate hike, but stalled at a typical resistance level.
2026-09-15 00:44:08
The US dollar index rose, driven by expectations of a Federal Reserve rate hike, but retreated after encountering resistance near 99.50, with a daily gain of about 0.4%. With only two days left before the Fed's interest rate meeting, the yield on the 10-year US Treasury note broke through 5% for the first time since October 2023. The euro fell to a one-month low, trading around 1.1500; the euro accounts for 57.6% of the dollar index's currency basket. A week ago, the European Central Bank raised its interest rate to 2.50%.  The US dollar index is currently trading around 99.50, up 0.4% on the day, with all gains occurring during the US market closure period. A 5% Treasury yield should sound like a major boost to the dollar, but the market was selling off the dollar in early New York trading. The reason is that currency strength depends on the interest rate differential between the currency and other economies, not the absolute value of interest rates, and the current interest rate differential has not widened further: the European Central Bank raised rates last week, the Bank of Japan will begin raising rates on Friday, and the market has almost fully priced in a rate hike from the Bank of England in November. A 5% US Treasury yield is not as beneficial to the dollar as it seems . From the Asian market opening on Sunday to the early London session, the dollar index rose 0.5 points, climbing from above 99.05 to around 99.60 at 08:00 GMT; the index rose again by 0.16 points before the New York stock market opened, but gave back all of those gains after the New York trading session began. The index peaked at 2:00 PM GMT, precisely the moment the 10-year US Treasury yield broke through 5%, and the dollar's rally came to an abrupt halt at that moment. The key lies in the driving factors behind the rising yields. Investors' increased holdings of US Treasuries are not due to a booming US economy; on the contrary, investors are willing to hold US Treasuries only if they demand higher yields. Behind this are the expanding scale of US government borrowing, companies investing hundreds of billions of dollars in building artificial intelligence data centers, and international oil prices breaking through $103 per barrel, continuously pushing inflation higher than the policy target. On Friday, the US launched an expanded version of its Treasury repurchase operation. This policy, intended to lower long-term yields, had a repurchase ceiling of $6 billion, with $5.2 billion actually executed, but the 10-year US Treasury yield still rose. It's important to distinguish between two scenarios: one is that global investors are actively willing to buy US Treasuries at higher prices; the other is that the US needs to pay higher costs to borrow money. The New York morning market was pricing in these two scenarios. Of the six currencies in the dollar index, three have central banks expected to take policy action this month. The euro accounts for 57.6% of the dollar index, so the dollar index's movement is essentially almost inversely related to the euro's. The euro is currently trading around 1.1500, a new low since mid-August, down about 0.5% on the day. The recent dollar rally is mainly due to the euro's weakness. Last Thursday, the European Central Bank raised interest rates to 2.50% as expected, a consensus reached by all 65 economists surveyed. Even if the Federal Reserve raises rates by 25 basis points on Wednesday, and the European Central Bank follows suit, the interest rate differential between the US and Europe will remain unchanged. The yen accounts for 13.6% of the index, and the market expects the Bank of Japan to raise interest rates to 1.25% on Friday. The yen has appreciated by 4% this month, and Japanese authorities have already spent $96.4 billion to support the yen; for the first time since February, speculative traders' bullish positions on the yen have exceeded their bearish positions. The British pound accounts for 11.9% of the index. The Bank of England will keep its interest rate unchanged at 3.75% on Thursday, with a 30% probability of a rate hike in the market, and the market has almost fully priced in a rate hike by the Bank of England in November. The market prices a roughly 90% probability of a rate hike by the Federal Reserve this time. Among the four major central banks, only the Fed's rate hike still has a certain degree of speculation. Oil prices breaking through $103 per barrel should also be beneficial to the US dollar: the US is an energy exporter, while Europe and Japan are highly dependent on crude oil imports; for every dollar increase in oil prices, wealth will shift from the Eurozone economy to the dollar zone. Since the end of August, international oil prices have surged from over $80 to above $103, and the dollar index has also risen from around 99.15 to around 99.50. However, high oil prices are also forcing the European Central Bank and the Bank of Japan to start raising interest rates, and the rate hikes in overseas economies will offset the benefits that energy brings to the dollar. Wednesday's focus will be on interest rate differentials, not the rate hike itself . The Federal Reserve will announce its interest rate decision at 18:00 GMT on Wednesday (02:00 Beijing time on Thursday). Futures markets indicate a roughly 90% probability of a 25 basis point rate hike, raising the federal funds rate from 3.50-3.75% to 3.75-4.00%. This rate hike itself has already been fully priced in by the market; the real variable lies in the Fed's dot plot, released simultaneously. The June dot plot shows a year-end rate of 3.8%, next year 3.6%, and 2028 3.4%, a path of "rate hikes now, rate cuts later." If Wednesday's dot plot signals further rate hikes, the interest rate differentials between the US and Europe, and between the US and Japan, will widen further next year, giving the dollar a chance to break out of its current trading range. If the dot plot remains consistent with the June version, the Fed will only raise rates once, while the ECB and the Bank of Japan will continue to tighten policies, narrowing the interest rate differentials between the US and Europe/Japan. On Wednesday at 12:30 GMT, the US August retail sales data will be released first, with the market expecting a 0.9% month-on-month increase, compared to a previous decrease of 0.6%. Retail sales are calculated in US dollars, and higher gasoline prices will sway the overall data. The controlled group of retail sales excluding fuel, automobiles, and building materials saw a previous month-on-month decrease of 0.4%, and this indicator better reflects actual consumption. UK August inflation data will be released Wednesday morning; the Bank of England will announce its policy decision at 11:00 GMT on Thursday, followed by the Bank of Japan on Friday. US initial jobless claims will be released at 12:30 GMT on Thursday, with an expected 205,000; Federal Reserve officials will speak publicly at 07:30 GMT on Friday. Key price levels and market trends.
 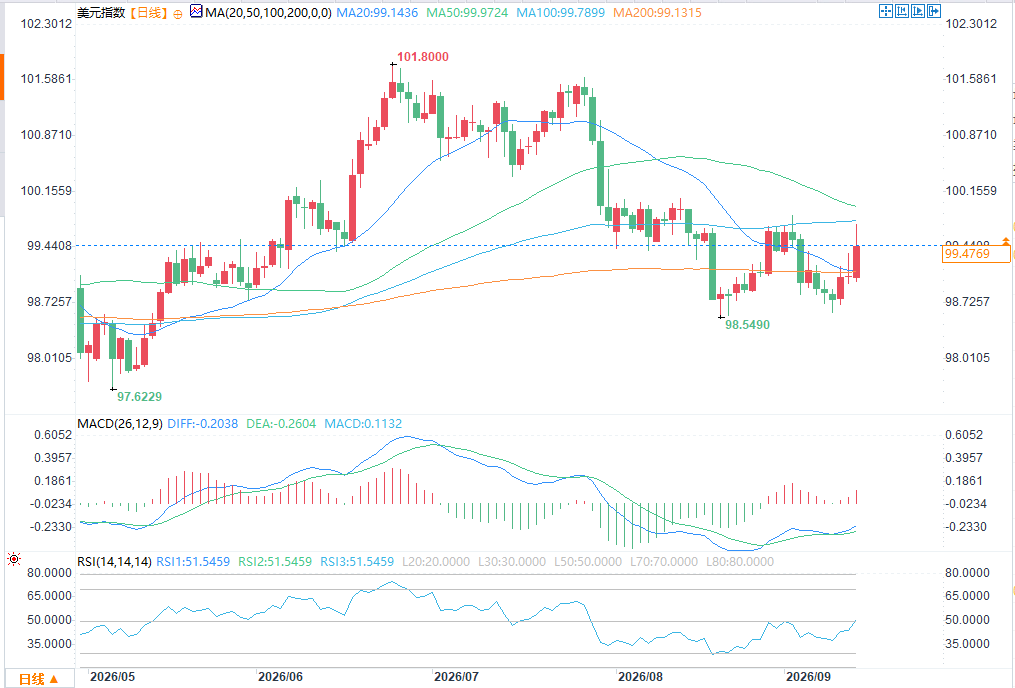 (Spot Gold Daily Chart Source: FX678) Resistance Level: The intraday high slightly below 99.75 is the main resistance level for this round. The 50-day and 200-day exponential moving averages (EMAs) coincide around 99.65, just below this resistance. Since August 28, the US dollar index has faced pressure and fallen back at this level for the fifth time; only on September 2, when the high was close to 99.90, did it briefly stand above this range. Support Level: The opening price of this week at 99.05 is the first support level; below that is the main trading range of last week at 98.80, and further down is the August low of 98.55. Market Trend: As long as the resistance at 99.75 is not broken, the overall trend is bearish, with the first target at 99.05, and further down to 98.80. The momentum indicator, the Stochastic Relative Strength Index (RSI), is currently reading close to 50; this indicator has been flat for four consecutive trading days since rebounding from the low of 16 on August 19. If the daily closing price holds above 99.75, the bearish logic will be invalidated, and the market will challenge the high point of September 2.
The US dollar index is currently trading around 99.50, up 0.4% on the day, with all gains occurring during the US market closure period. A 5% Treasury yield should sound like a major boost to the dollar, but the market was selling off the dollar in early New York trading. The reason is that currency strength depends on the interest rate differential between the currency and other economies, not the absolute value of interest rates, and the current interest rate differential has not widened further: the European Central Bank raised rates last week, the Bank of Japan will begin raising rates on Friday, and the market has almost fully priced in a rate hike from the Bank of England in November. A 5% US Treasury yield is not as beneficial to the dollar as it seems . From the Asian market opening on Sunday to the early London session, the dollar index rose 0.5 points, climbing from above 99.05 to around 99.60 at 08:00 GMT; the index rose again by 0.16 points before the New York stock market opened, but gave back all of those gains after the New York trading session began. The index peaked at 2:00 PM GMT, precisely the moment the 10-year US Treasury yield broke through 5%, and the dollar's rally came to an abrupt halt at that moment. The key lies in the driving factors behind the rising yields. Investors' increased holdings of US Treasuries are not due to a booming US economy; on the contrary, investors are willing to hold US Treasuries only if they demand higher yields. Behind this are the expanding scale of US government borrowing, companies investing hundreds of billions of dollars in building artificial intelligence data centers, and international oil prices breaking through $103 per barrel, continuously pushing inflation higher than the policy target. On Friday, the US launched an expanded version of its Treasury repurchase operation. This policy, intended to lower long-term yields, had a repurchase ceiling of $6 billion, with $5.2 billion actually executed, but the 10-year US Treasury yield still rose. It's important to distinguish between two scenarios: one is that global investors are actively willing to buy US Treasuries at higher prices; the other is that the US needs to pay higher costs to borrow money. The New York morning market was pricing in these two scenarios. Of the six currencies in the dollar index, three have central banks expected to take policy action this month. The euro accounts for 57.6% of the dollar index, so the dollar index's movement is essentially almost inversely related to the euro's. The euro is currently trading around 1.1500, a new low since mid-August, down about 0.5% on the day. The recent dollar rally is mainly due to the euro's weakness. Last Thursday, the European Central Bank raised interest rates to 2.50% as expected, a consensus reached by all 65 economists surveyed. Even if the Federal Reserve raises rates by 25 basis points on Wednesday, and the European Central Bank follows suit, the interest rate differential between the US and Europe will remain unchanged. The yen accounts for 13.6% of the index, and the market expects the Bank of Japan to raise interest rates to 1.25% on Friday. The yen has appreciated by 4% this month, and Japanese authorities have already spent $96.4 billion to support the yen; for the first time since February, speculative traders' bullish positions on the yen have exceeded their bearish positions. The British pound accounts for 11.9% of the index. The Bank of England will keep its interest rate unchanged at 3.75% on Thursday, with a 30% probability of a rate hike in the market, and the market has almost fully priced in a rate hike by the Bank of England in November. The market prices a roughly 90% probability of a rate hike by the Federal Reserve this time. Among the four major central banks, only the Fed's rate hike still has a certain degree of speculation. Oil prices breaking through $103 per barrel should also be beneficial to the US dollar: the US is an energy exporter, while Europe and Japan are highly dependent on crude oil imports; for every dollar increase in oil prices, wealth will shift from the Eurozone economy to the dollar zone. Since the end of August, international oil prices have surged from over $80 to above $103, and the dollar index has also risen from around 99.15 to around 99.50. However, high oil prices are also forcing the European Central Bank and the Bank of Japan to start raising interest rates, and the rate hikes in overseas economies will offset the benefits that energy brings to the dollar. Wednesday's focus will be on interest rate differentials, not the rate hike itself . The Federal Reserve will announce its interest rate decision at 18:00 GMT on Wednesday (02:00 Beijing time on Thursday). Futures markets indicate a roughly 90% probability of a 25 basis point rate hike, raising the federal funds rate from 3.50-3.75% to 3.75-4.00%. This rate hike itself has already been fully priced in by the market; the real variable lies in the Fed's dot plot, released simultaneously. The June dot plot shows a year-end rate of 3.8%, next year 3.6%, and 2028 3.4%, a path of "rate hikes now, rate cuts later." If Wednesday's dot plot signals further rate hikes, the interest rate differentials between the US and Europe, and between the US and Japan, will widen further next year, giving the dollar a chance to break out of its current trading range. If the dot plot remains consistent with the June version, the Fed will only raise rates once, while the ECB and the Bank of Japan will continue to tighten policies, narrowing the interest rate differentials between the US and Europe/Japan. On Wednesday at 12:30 GMT, the US August retail sales data will be released first, with the market expecting a 0.9% month-on-month increase, compared to a previous decrease of 0.6%. Retail sales are calculated in US dollars, and higher gasoline prices will sway the overall data. The controlled group of retail sales excluding fuel, automobiles, and building materials saw a previous month-on-month decrease of 0.4%, and this indicator better reflects actual consumption. UK August inflation data will be released Wednesday morning; the Bank of England will announce its policy decision at 11:00 GMT on Thursday, followed by the Bank of Japan on Friday. US initial jobless claims will be released at 12:30 GMT on Thursday, with an expected 205,000; Federal Reserve officials will speak publicly at 07:30 GMT on Friday. Key price levels and market trends. (Spot Gold Daily Chart Source: FX678) Resistance Level: The intraday high slightly below 99.75 is the main resistance level for this round. The 50-day and 200-day exponential moving averages (EMAs) coincide around 99.65, just below this resistance. Since August 28, the US dollar index has faced pressure and fallen back at this level for the fifth time; only on September 2, when the high was close to 99.90, did it briefly stand above this range. Support Level: The opening price of this week at 99.05 is the first support level; below that is the main trading range of last week at 98.80, and further down is the August low of 98.55. Market Trend: As long as the resistance at 99.75 is not broken, the overall trend is bearish, with the first target at 99.05, and further down to 98.80. The momentum indicator, the Stochastic Relative Strength Index (RSI), is currently reading close to 50; this indicator has been flat for four consecutive trading days since rebounding from the low of 16 on August 19. If the daily closing price holds above 99.75, the bearish logic will be invalidated, and the market will challenge the high point of September 2.
- Risk Warning and Disclaimer
- The market involves risk, and trading may not be suitable for all investors. This article is for reference only and does not constitute personal investment advice, nor does it take into account certain users’ specific investment objectives, financial situation, or other needs. Any investment decisions made based on this information are at your own risk.