Why did gold initially decline after the interest rate hike, and how much room is there for a rebound?
2026-09-17 17:40:11
On Thursday (September 17), spot gold rebounded during the Asian and European sessions, recovering most of Wednesday's losses. On Wednesday, following the Federal Reserve's interest rate decision and dot plot, gold prices plunged by about 3% intraday, currently trading around 4316. The main recent development is that the Fed's dot plot indicated one more 25bp rate hike by the end of this year, exceeding market expectations, but also suggested at most one rate hike next year. This gave the market a glimpse of the ceiling for rising interest rates and alleviated market uncertainty regarding inflation. Overall, from the perspective of the US Treasury yield curve valuation, this is actually bullish for gold and equity assets. 
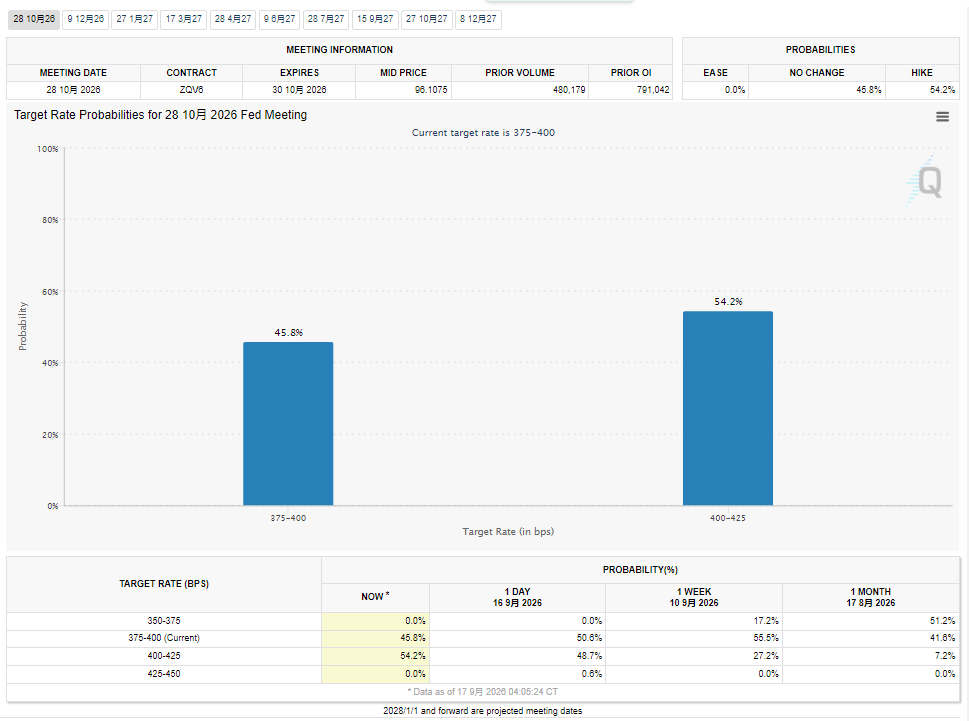 (FedWatch interest rate futures tool, source: CME Group) The dot plot shows an end-of-year interest rate of 4-4.25%, which is an unexpected signal of continuous interest rate hikes. This instantly pushed up the market's short-term real interest rate and the US dollar index, putting pressure on gold and causing it to plummet. The largest single-day drop during the session reached 2%, and short-term negative sentiment was released in a concentrated manner.
 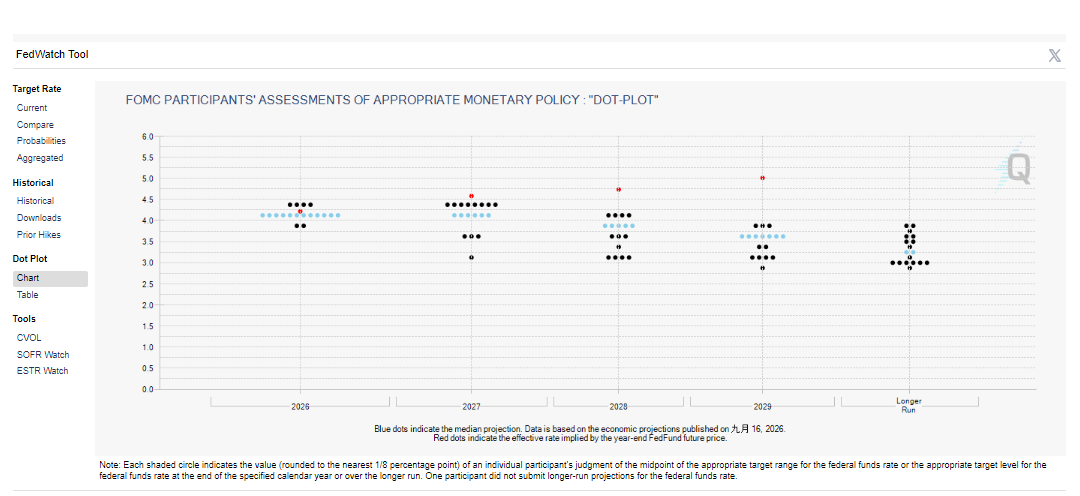 (Dot plot, where black dots represent actual votes and blue dots represent median forecasts. Source: CME Group)
 (Treasury yields rose overall, but longer-term yields rose more slowly than short-term yields. Source: Federal Reserve)
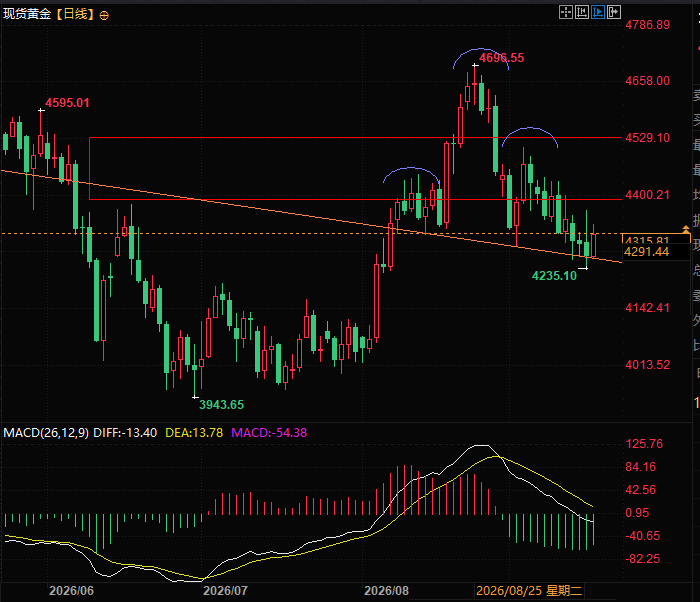 (Spot gold daily chart, source: EasyTrade) At 17:33 Beijing time, spot gold is currently trading at $4308 per ounce.
The interest rate decision was more hawkish than expected, putting significant downward pressure on gold prices in the short term.
The Federal Reserve's FOMC interest rate decision in September 2026 was officially released. The Fed resumed raising interest rates after a three-year hiatus, increasing them by 25 basis points to raise the federal funds rate range to 3.75%-4.00%. However, the core negative factor of this decision was not the rate hike itself, but rather the updated dot plot, which significantly exceeded market expectations. The latest dot plot data shows that over 80% of the 18 voting officials believed the Fed would raise rates again by 25 basis points before the end of 2026, directly revising the median policy rate to 4.25% by the end of the year, exceeding market expectations, even though interest rate futures indicated only a 53% probability of another rate hike. (FedWatch interest rate futures tool, source: CME Group) The dot plot shows an end-of-year interest rate of 4-4.25%, which is an unexpected signal of continuous interest rate hikes. This instantly pushed up the market's short-term real interest rate and the US dollar index, putting pressure on gold and causing it to plummet. The largest single-day drop during the session reached 2%, and short-term negative sentiment was released in a concentrated manner. (Dot plot, where black dots represent actual votes and blue dots represent median forecasts. Source: CME Group)Policy direction sets the tone, locking in upside risks; gold poised for a key reversal opportunity.
After a rapid sell-off in the short term, gold quickly halted its decline and began a corrective rebound this morning. The core turning point came from the dot plot's clear indication of the medium- to long-term interest rate path, completing a logical shift in the market from "panic over rate hikes" to "pricing the peak of interest rates." This SEP (Securities and Economic Prospects) summary clearly states that the Federal Reserve is highly likely to maintain its policy rate unchanged in 2027, with at most one more rate hike remaining throughout the cycle. This means that the upside potential for interest rates in this tightening cycle has been completely locked in, and the pessimistic expectation of "unlimited rate hikes and continued high tightening" that the market has been speculating on has been completely cleared. At the same time, the Fed's strong measures in this round of consecutive rate hikes have effectively suppressed global medium- to long-term inflation expectations, significantly reducing market inflation uncertainty and causing the US Treasury term premium to continue to decline. As a result, the US Treasury yield curve underwent a key structural shift: in the initial period after the decision, short-term yields rose rapidly, while the 30-year long-term Treasury yield rose significantly later, almost flat; subsequently, US Treasury yields across the entire cycle collectively declined, and the yield curve shifted from a bear steepening to a bear flattening structure. This structural shift is highly beneficial to the market. The decline in long-term discount rates directly alleviates the valuation pressure on long-duration assets, and long-duration assets such as gold and technology stocks are simultaneously experiencing a valuation recovery. (Treasury yields rose overall, but longer-term yields rose more slowly than short-term yields. Source: Federal Reserve)The marginal cooling of oil prices further supported the rebound in gold prices.
Besides favorable monetary policy, the recent marginal decline in the oil market has become a significant supporting driver for the gold rebound. Previously, the ongoing geopolitical conflict in the Middle East, which pushed up oil prices and solidified high inflation expectations, was one of the core constraints suppressing the gold rebound. However, the current situation in the Middle East shows signs of easing. US President Trump has publicly stated that the nearly seven-month-long US-Iran conflict is expected to end quickly, and Iran has also expressed its willingness to negotiate, with the two sides having begun direct diplomatic contact. Meanwhile, the gradual resumption of Saudi oil pipelines and the continued recovery of shipping volume in the Strait of Hormuz have marginally eased global oil supply anxieties, leading to a slight pullback in high oil prices and further weakening market expectations of rigid inflation. The easing of inflationary pressures, coupled with the formation of a bear market in the bond market, has created a double positive factor, propelling gold to completely break free from its short-term downtrend and begin a phase of recovery and rebound.Multiple resilience risks are suppressing gains, making a sustained bull market in gold unlikely.
Despite the current clear recovery in gold prices, multiple constraints determine that this rebound is a structural correction rather than a sustained upward trend, thus limiting further upside potential. Firstly, the crude oil market has not weakened significantly and remains remarkably resilient. While short-term supply recovery has led to a slight price decline, the underlying geopolitical stalemate in the Middle East remains unresolved: Iran continues to control the Strait of Hormuz, posing a potential threat of localized shipping conflicts; the Houthis control a key Red Sea shipping lane with no effective counterbalance; and the US strategic petroleum reserves are at a decades-low level, coupled with a severe shortage of global crude oil buffer inventories, ensuring that oil prices will continue to fluctuate at high levels. The robust crude oil prices continue to support persistent inflation, and the inability to completely eliminate inflationary risks continues to limit the extent of gold's rebound. Secondly, the core logic of the Federal Reserve's policy of "maintaining high interest rates for longer" remains unchanged. Although the room for interest rate hikes in 2027 is essentially locked in, the medium- to long-term high-interest-rate environment will persist, keeping the opportunity cost of holding gold consistently high and making it difficult to support a sustained bull market for gold.Market Outlook Summary: The market is expected to consolidate and recover; avoid chasing highs.
In summary, the current gold market exhibits a clear and balanced bullish/bearish logic: in the short term, it benefits from the formation of a flattening US Treasury yield curve, the clearing of upward interest rate risks, and a marginal cooling of oil prices, providing momentum for a sustained rebound; however, in the medium to long term, it is constrained by the resilience of oil prices supporting inflation and the continued high interest rates, lacking a basis for a unilateral surge. The core trading theme for gold going forward is high-level range-bound trading and structural correction. The market will continue to oscillate between the strength of inflation stickiness and expectations of monetary policy easing, generally presenting a pattern of "limited downside and limited upside." Trading should focus on buying on dips to correct the market, avoiding the risks of chasing highs. Technically, spot gold is still rebounding based on the previously mentioned head and shoulders neckline, with resistance at the lower edge of the trading range around 4400. (Spot gold daily chart, source: EasyTrade) At 17:33 Beijing time, spot gold is currently trading at $4308 per ounce.
- Risk Warning and Disclaimer
- The market involves risk, and trading may not be suitable for all investors. This article is for reference only and does not constitute personal investment advice, nor does it take into account certain users’ specific investment objectives, financial situation, or other needs. Any investment decisions made based on this information are at your own risk.