













Behind Gold's Weekly Positive Chart: Oil Price Decline Provides Support, Central Bank Tightening Continues to Be Recorded
2026-09-21 15:48:14
On Monday, September 21, spot gold was trading around $4,350 per ounce. In the past week, spot gold recorded its first weekly gain in nearly a month. The Federal Reserve raised the target range for the federal funds rate by 25 basis points to 3.75% to 4.00% on September 16, and the Bank of Japan raised its policy rate to 1.25% on September 18, the highest level in approximately 31 years. Brent crude oil has retreated from its mid-month high to around $102 per barrel, while the dollar index is trading above the 100 mark. Gold faces a pricing environment where easing oil prices coexist with a continued tightening stance from major central banks. 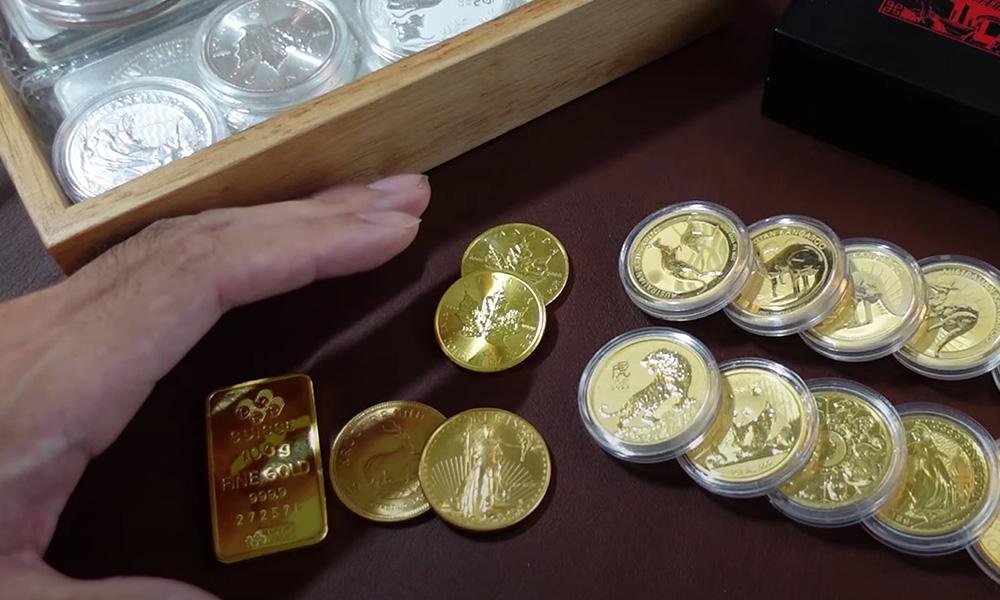
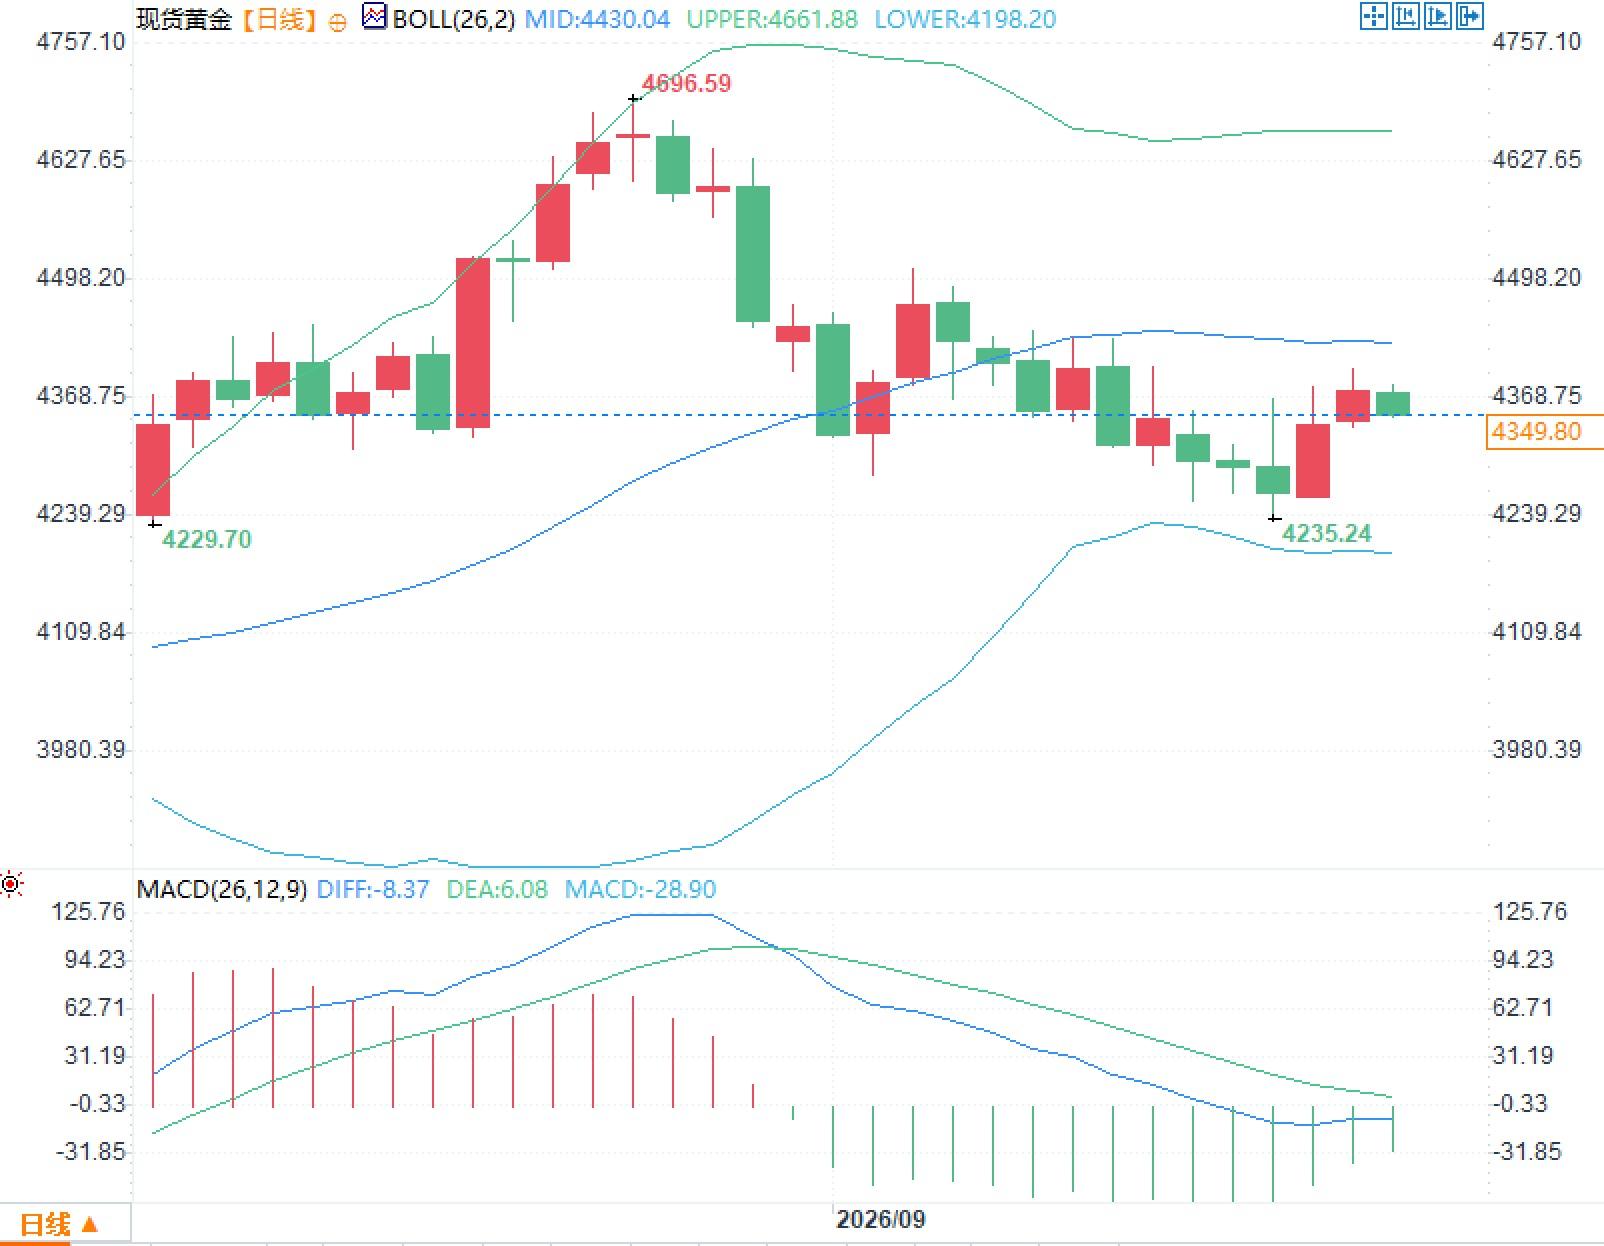 The MACD currently shows a DIFF of approximately -8.37, a DEA of approximately 6.08, and a histogram of approximately -28.90. The fast line is below the signal line, and the histogram remains below the zero line, reflecting that the short-term moving averages have not yet returned to a bullish alignment. The appearance of negative momentum readings simultaneously with the weekly recovery indicates that the short-term correction has not yet been confirmed by medium-term momentum.
Weekly repairs cannot rewrite cross-asset constraints.
Last week's weekly recovery in spot gold should first be viewed within a longer timeframe. In mid-September, prices dipped to around $4235/oz before recovering amid a combination of interest rate decisions and falling oil prices, but this recovery occurred after a pullback from the year's high. Market data shows that spot gold is still down about 3% from its late August high, and the upper limit of its 52-week trading range remains significantly higher than current prices. Across asset classes, constraints have not eased accordingly. The US dollar index climbed back above 100 after the interest rate decision, and the two-year US Treasury yield continues to be priced around the policy path. Since gold is priced in US dollars and does not generate coupons, any upward revisions to dollar financing costs and short-term interest rate expectations will directly impact holding costs. Last week's gold price recovery is more attributable to a pullback in oil prices from mid-month highs and a temporary cooling of inflation trading, rather than a shift in the real interest rate narrative. Interpreting weekly gains directly as trend confirmation ignores the fact that the two main constraints of interest rates and exchange rates remain in effect.The synchronized tightening by major central banks has increased the comparative cost of zero-coupon assets.
On September 16, the Federal Open Market Committee (FOMC) voted 12-0 to raise the target range for the federal funds rate by 25 basis points. This is the first rate hike since mid-2023. The statement noted that inflation remains high and this action aims to return to the 2% target more promptly. Fed Chairman Warsh said at the post-meeting press conference that inflation is high and has persisted for too long, and the summer readings did not show a substantial improvement in the trend; based on the price data available at the time, the year-on-year growth rate of overall personal consumption expenditures (PCE) in August was around 3.6%. He also stated that it is difficult to describe broad financial conditions as restrictive, therefore this rate hike is a withdrawal of some easing. The Fed's summary of economic projections also indicates a tightening path. Of the 18 members who submitted projections, 16 expect at least one more rate hike in 2026, with a median federal funds rate of approximately 4.1% at the end of the year, corresponding to a target range of 4.00% to 4.25%. The median PCE inflation forecast for 2026 has been revised upward to 3.7%, and the median unemployment rate is expected to be around 4.1%. Interest rate futures and event contracts are pricing in a 50% to 60% probability of a 25 basis point rate hike at the October meeting. For gold pricing, the key issue isn't whether there will be a rate hike at the next meeting, but rather that the market is still paying a premium for a higher policy path. Last week, the Bank of Japan voted 7-2 to raise its policy rate from 1.00% to 1.25%. Governor Kazuo Ueda stated after the meeting that policy has entered a new phase, with underlying inflation previously assessed as below 2%; given the still relatively loose financial environment, interest rates will continue to rise, and the degree of easing will be adjusted. He did not give a specific timing for the next action, nor did he rule out further adjustments. Yen carry trades have long constituted part of global liquidity, and a rise in policy rates will change the marginal cost of this funding. The fact that the Federal Reserve and the Bank of Japan gave tightening signals in the same week effectively puts the comparative return of gold back into the global interest rate framework for calculation.The decline in oil prices has eased the inflation trade, but it has not eliminated the risk premium.
Brent crude oil briefly approached $109-$110 per barrel in mid-September before falling back, currently trading around $102 per barrel. The immediate backdrop to this decline is a easing of market concerns about Saudi supply disruptions, a factor that temporarily outweighs the tail risk of a potential escalation of the Middle East situation. For gold, the decline in oil prices has altered at least two transmission chains. The first is inflation expectations. Crude oil is one of the most sensitive inputs to global inflation expectations. The decline in oil prices reduces the urgency of a resurgence of imported inflation, thus weakening the short-term incentive to increase gold holdings as an inflation hedge. The second is risk premiums. The Middle East situation has not disappeared; only the pricing power of supply disruptions has temporarily given way to trade in inventory and transportation recovery. Once shipping or production disruptions re-enter the market, oil and gold risk premiums may rise in tandem again. The current combination is therefore mixed: the decline in oil prices has reduced the fervor of inflation trading, while statements from major central banks have kept real interest rate expectations at a relatively high level. Gold's ability to recover its weekly losses last week was a result of a temporary balance between these two forces, rather than a victory for a single logic. Warsh also emphasized at the press conference that central banks cannot unilaterally determine the absolute prices of crude oil or food, but they have a responsibility to prevent relative price changes from spreading to broader prices. This statement separates the energy shock from monetary policy: falling oil prices may reduce the urgency of interest rate hikes, but it does not automatically prove that the policy path has been completed.Daily Indicator Observation
The daily Bollinger Bands show the middle band at approximately $4430/oz, the upper band at approximately $4662/oz, and the lower band at approximately $4198/oz. With prices trading below the middle band and the band widening after a previous period, a consolidation phase has emerged, indicating that volatility has shifted from a one-sided upward trend to range-bound trading. The fluctuations around the middle band are more indicative of a reassessment of cost basis by both bulls and bears following the interest rate decision, rather than a trend reversal. The MACD currently shows a DIFF of approximately -8.37, a DEA of approximately 6.08, and a histogram of approximately -28.90. The fast line is below the signal line, and the histogram remains below the zero line, reflecting that the short-term moving averages have not yet returned to a bullish alignment. The appearance of negative momentum readings simultaneously with the weekly recovery indicates that the short-term correction has not yet been confirmed by medium-term momentum.
- Risk Warning and Disclaimer
- The market involves risk, and trading may not be suitable for all investors. This article is for reference only and does not constitute personal investment advice, nor does it take into account certain users’ specific investment objectives, financial situation, or other needs. Any investment decisions made based on this information are at your own risk.

