Gold remains below the middle Bollinger Band on the daily chart: Is $4300 the bottom?
2026-09-25 17:16:15
On Friday, September 25th, spot gold was trading around $4300 per ounce. Over the past week, spot gold has fallen by approximately 2.5%, still about 21% lower than its closing high of $5405 per ounce on January 29th. Market pricing has shifted from a simple safe-haven premium to a triple constraint from crude oil, US Treasury real interest rates, and the US dollar index, compounded by the pace of US-Iran negotiations over the Strait of Hormuz. On September 16th, the Federal Reserve raised the target range for the federal funds rate by 25 basis points to 3.75% to 4.00%. The preliminary reading of the S&P Global Manufacturing Purchasing Managers' Index (PMI) for September, released on September 23rd, was 57.0, with the services sector at 58.7 and the composite index at 58.4, higher than the market expectation of 55.2 and also higher than August's 56.0. The composite index was described as the fastest output expansion in over five years. Williamson, chief business economist at S&P Global Market Intelligence, said that U.S. corporate output grew at its fastest pace in more than five years, and corporate input costs rose to a four-year high. Oil prices pushed up fuel and transportation costs, which will continue to be transmitted to commodity prices and overall inflation. Money markets have raised the probability of the Federal Reserve raising interest rates by another 25 basis points at its October 27-28 meeting to approximately 66% to 73%. The 10-year U.S. Treasury yield rose to 5.11% on September 23, briefly touching 5.148% during the session; the 2-year U.S. Treasury yield rose to approximately 4.89%; and the dollar index climbed to around 101, a level that has lasted for about eight weeks. 
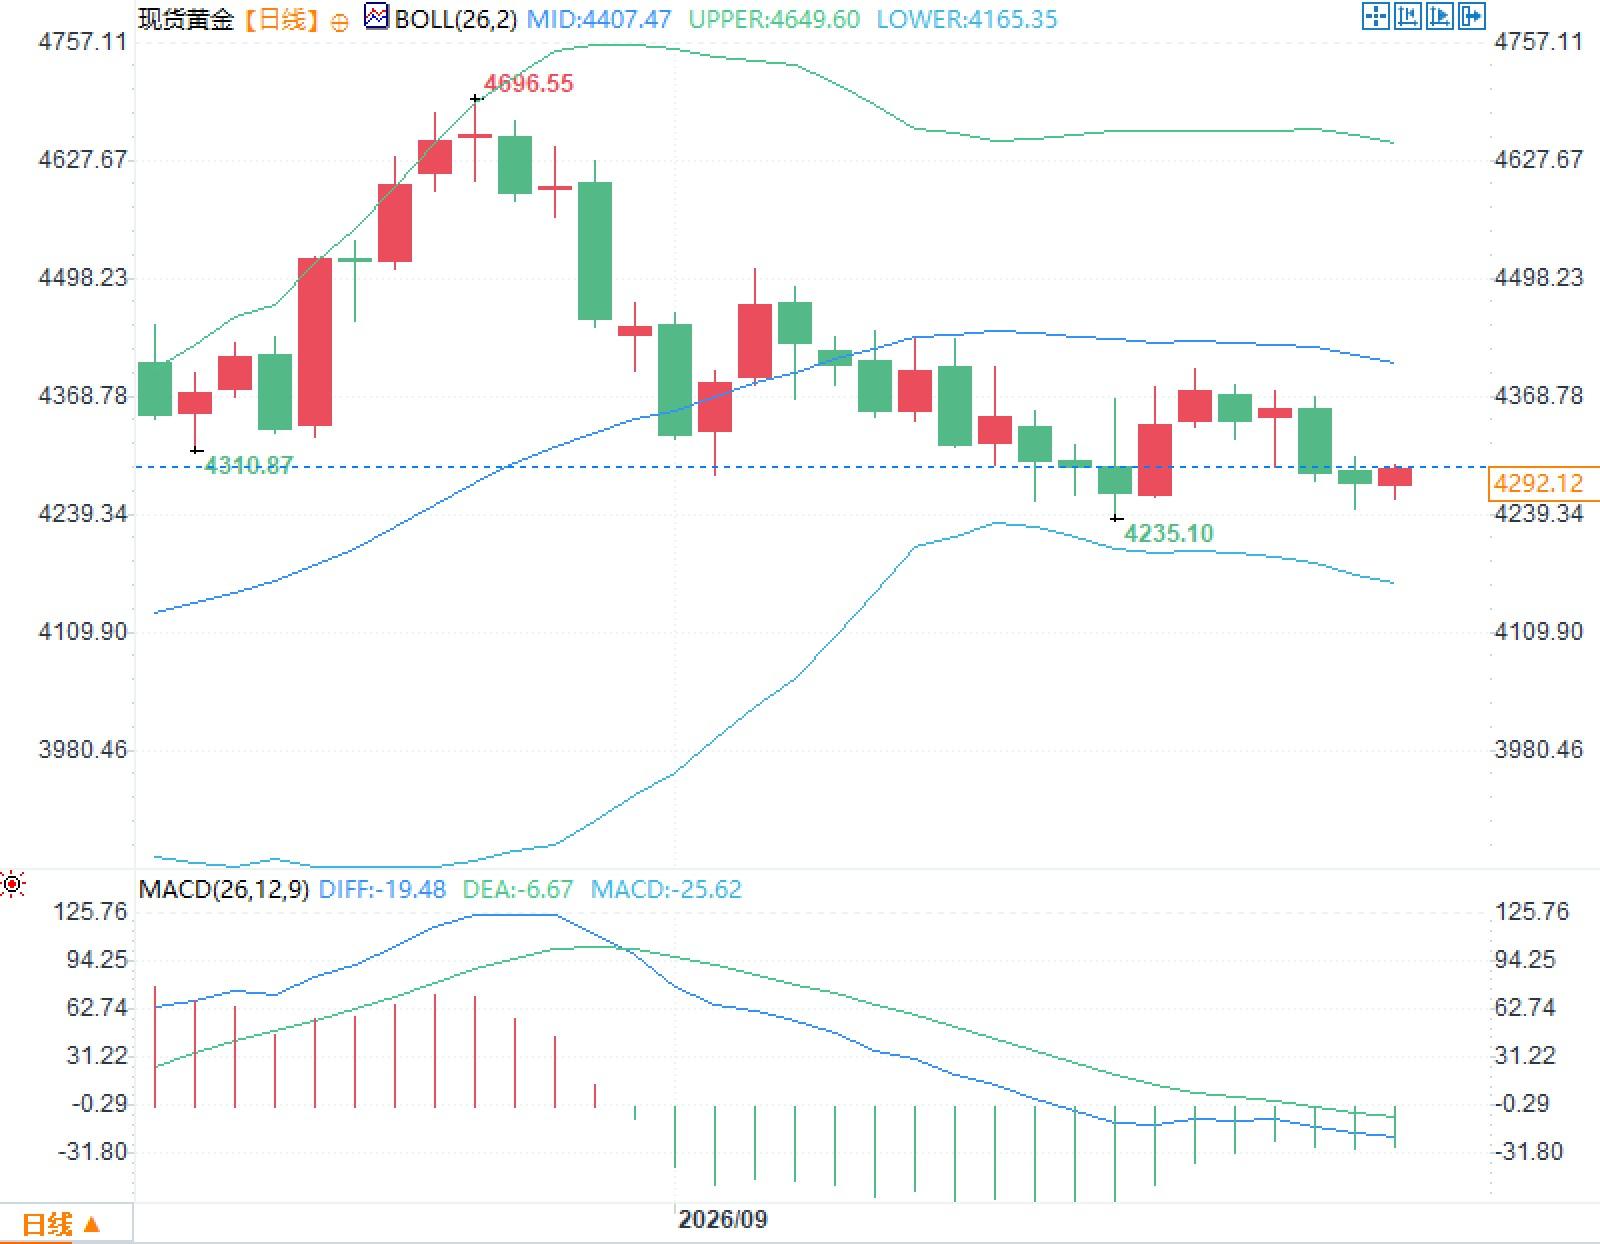 The recent candlestick patterns show shortened bodies and alternating upper and lower shadows, indicating price convergence after periods of high volatility. The MACD parameters DIFF is -19.48, DEA is -6.67, and the histogram value is -25.62, all below the zero line, reflecting a continued weak alignment of the medium-term moving average system.
Rising real interest rates are rewriting the cost of holding gold.
The core of gold pricing is not the nominal safe-haven narrative, but rather the real returns forgone by holding gold. On September 23, the US 10-year real yield rose to 2.76% from 2.63% the previous trading day, an increase of 13 basis points in a single day. The nominal 10-year yield simultaneously broke through 5%, indicating that the market is not only repricing growth but also inflation stickiness. Federal Reserve Governor Barr stated after the release of the Purchasing Managers' Index that further interest rate hikes are likely still necessary to bring inflation back to the target in a timely manner. St. Louis Fed President Musaleem stated that strong demand coupled with the impact of commodity price shocks that have spread beyond crude oil necessitates that monetary authorities act sooner rather than wait. The dot plot shows that 16 out of 18 officials expect the policy rate to be higher than the current target range by the end of 2026, with a year-end median of approximately 4.1%. For gold, this means that the cost of holding has shifted from "potentially tightening again" to "a tightening path being rewritten into the forward curve." The US dollar index rose to around 101, strengthening the relative attractiveness of dollar-denominated assets. Rising oil prices could push up inflation expectations, but could also force a tighter policy path, leading to a simultaneous strengthening of real interest rates and the US dollar. Gold, therefore, faces two conflicting forces: energy premiums and tightening financial conditions.The Hormuz negotiations have re-tethered the energy premium to the interest rate path.
The Strait of Hormuz handles approximately one-fifth of the world's seaborne crude oil and liquefied natural gas, making it a crucial valve for the current gold-oil linkage. The conflict between Iran and the US has lasted nearly seven months. A memorandum of understanding in June attempted to reopen the strait in phases, but it broke down in July. The market initially traded a combination of "early easing of the conflict, reduced expectations of interest rate hikes, and declining real interest rates," providing a temporary buffer for gold. After the US announced it would postpone the agreement window until after the November election, crude oil, US Treasury yields, and the US dollar all rose in tandem, putting pressure on gold. Iranian Foreign Minister Araqchi subsequently disclosed at the UN General Assembly in New York that a proposal had been put forward through an intermediary: if the US meets certain conditions, the Strait of Hormuz could be reopened in seven days. Araqchi stated that once the US accepts, "the countdown will begin the next day, and the strait will be open in seven days," adding that "it would be better if it could be completed before the midterm elections, but it depends on the US decision; Iran is not in a hurry." White House officials stated that the two sides are engaged in constructive discussions through an intermediary, but did not confirm the timetable. In his speech at the UN General Assembly, Iranian President Peskov emphasized that a situation should not arise where all parties benefit from the Strait of Hormuz while Iran is deprived of its right to use the waterway. He stated that the permanent presence of a hostile fleet and the spillover effects of conflict would not help restore shipping order. Araqchi remained in New York over the weekend awaiting a response from the US. If negotiations achieve a breakthrough, energy supply constraints will ease, and interest rate hike pricing and real interest rates may reverse in tandem. If the stalemate continues or escalates further, financial conditions will remain tight, and gold will continue to face pressure from oil prices, yields, and the US dollar.Daily indicator structure
The daily Bollinger Bands show the middle band at $4407.47/oz, the upper band at $4649.60/oz, and the lower band at $4165.35/oz. The price is below the middle band and above the lower band, and the band width has narrowed compared to the previous surge, indicating a pullback in volatility from its highs, but this does not necessarily mean a trend reversal. The recent candlestick patterns show shortened bodies and alternating upper and lower shadows, indicating price convergence after periods of high volatility. The MACD parameters DIFF is -19.48, DEA is -6.67, and the histogram value is -25.62, all below the zero line, reflecting a continued weak alignment of the medium-term moving average system.Financial conditions have become the dominant constraint on gold.
The direct trigger for this round of gold price pullback is financial conditions, not the disappearance of safe-haven demand. The 10-year US Treasury yield has risen to near its highest level since 2007, the 30-year yield to near its highest level since 2004, and the 2-year yield is close to 4.9%, indicating that short-term policy expectations and long-term term premiums are rising simultaneously. Gold, as a zero-coupon asset, is most sensitive to this combination. Crude oil acts as an amplifier. The fluctuating expectations of the Taiwan Strait opening have led to wide-ranging fluctuations in oil prices at high levels. Rising energy prices increase both the safe-haven premium and the probability of interest rate hikes. Which force prevails depends on whether negotiations compress the risk premium or incorporate supply shocks into the longer-term policy path. The watchlist for the next few days includes: whether Araghshi brings back a verifiable timetable, whether oil prices fall with expectations of the opening of the Strait, and whether the 10-year US Treasury real yield swings back from 2.76%. Until these variables change, gold will continue to be priced within the constraints of high real interest rates, a strong dollar, and highly volatile crude oil.- Risk Warning and Disclaimer
- The market involves risk, and trading may not be suitable for all investors. This article is for reference only and does not constitute personal investment advice, nor does it take into account certain users’ specific investment objectives, financial situation, or other needs. Any investment decisions made based on this information are at your own risk.