A chart summarizing "pivot points + long/short position signals" for gold, crude oil, forex, and stock indices; 7 commodities are overbought.
2026-10-12 13:54:17
The latest data released today (Monday, October 12, 2026) shows that, as of now, [in this chart, 7 instruments are currently in an "overbought" state (long positions exceeding 80%), and 1 instrument is currently in an "oversold" state (long positions less than 20%). [Among them, the highest percentage of long positions is in the FTSE China A50. Spot gold (XAU/USD) has a long position percentage of 86%, US crude oil (WTI OIL) has a long position percentage of 47%, and euro/dollar (EUR/USD) has a long position percentage of 68%. For updated "change signals" and a more detailed list of these instruments compared to yesterday, please refer to the chart specially prepared by FX678. [Among the change signals in positions, 5 show an increase in net long positions, 10 show a decrease in net long positions, 3 show an increase in net short positions, 1 show a decrease in net short positions, and 1 shows a shift from net long to short balance.] The following instruments have long positions of 80% or more: ★ Spot Gold (XAU/USD) with a long position ratio of 86%. ★ FTSE China A50 with a long position ratio of 98%. ★ HK50 Hang Seng with a long position ratio of 90%. ★ EUR/AUD with a long position ratio of 81%. ★ USD/CAD with a short position ratio of 90%. ★ NZD/USD with a long position ratio of 96%. ★ NZD/JPY with a long position ratio of 88%. ★ USD/CNH with a long position ratio of 81%. 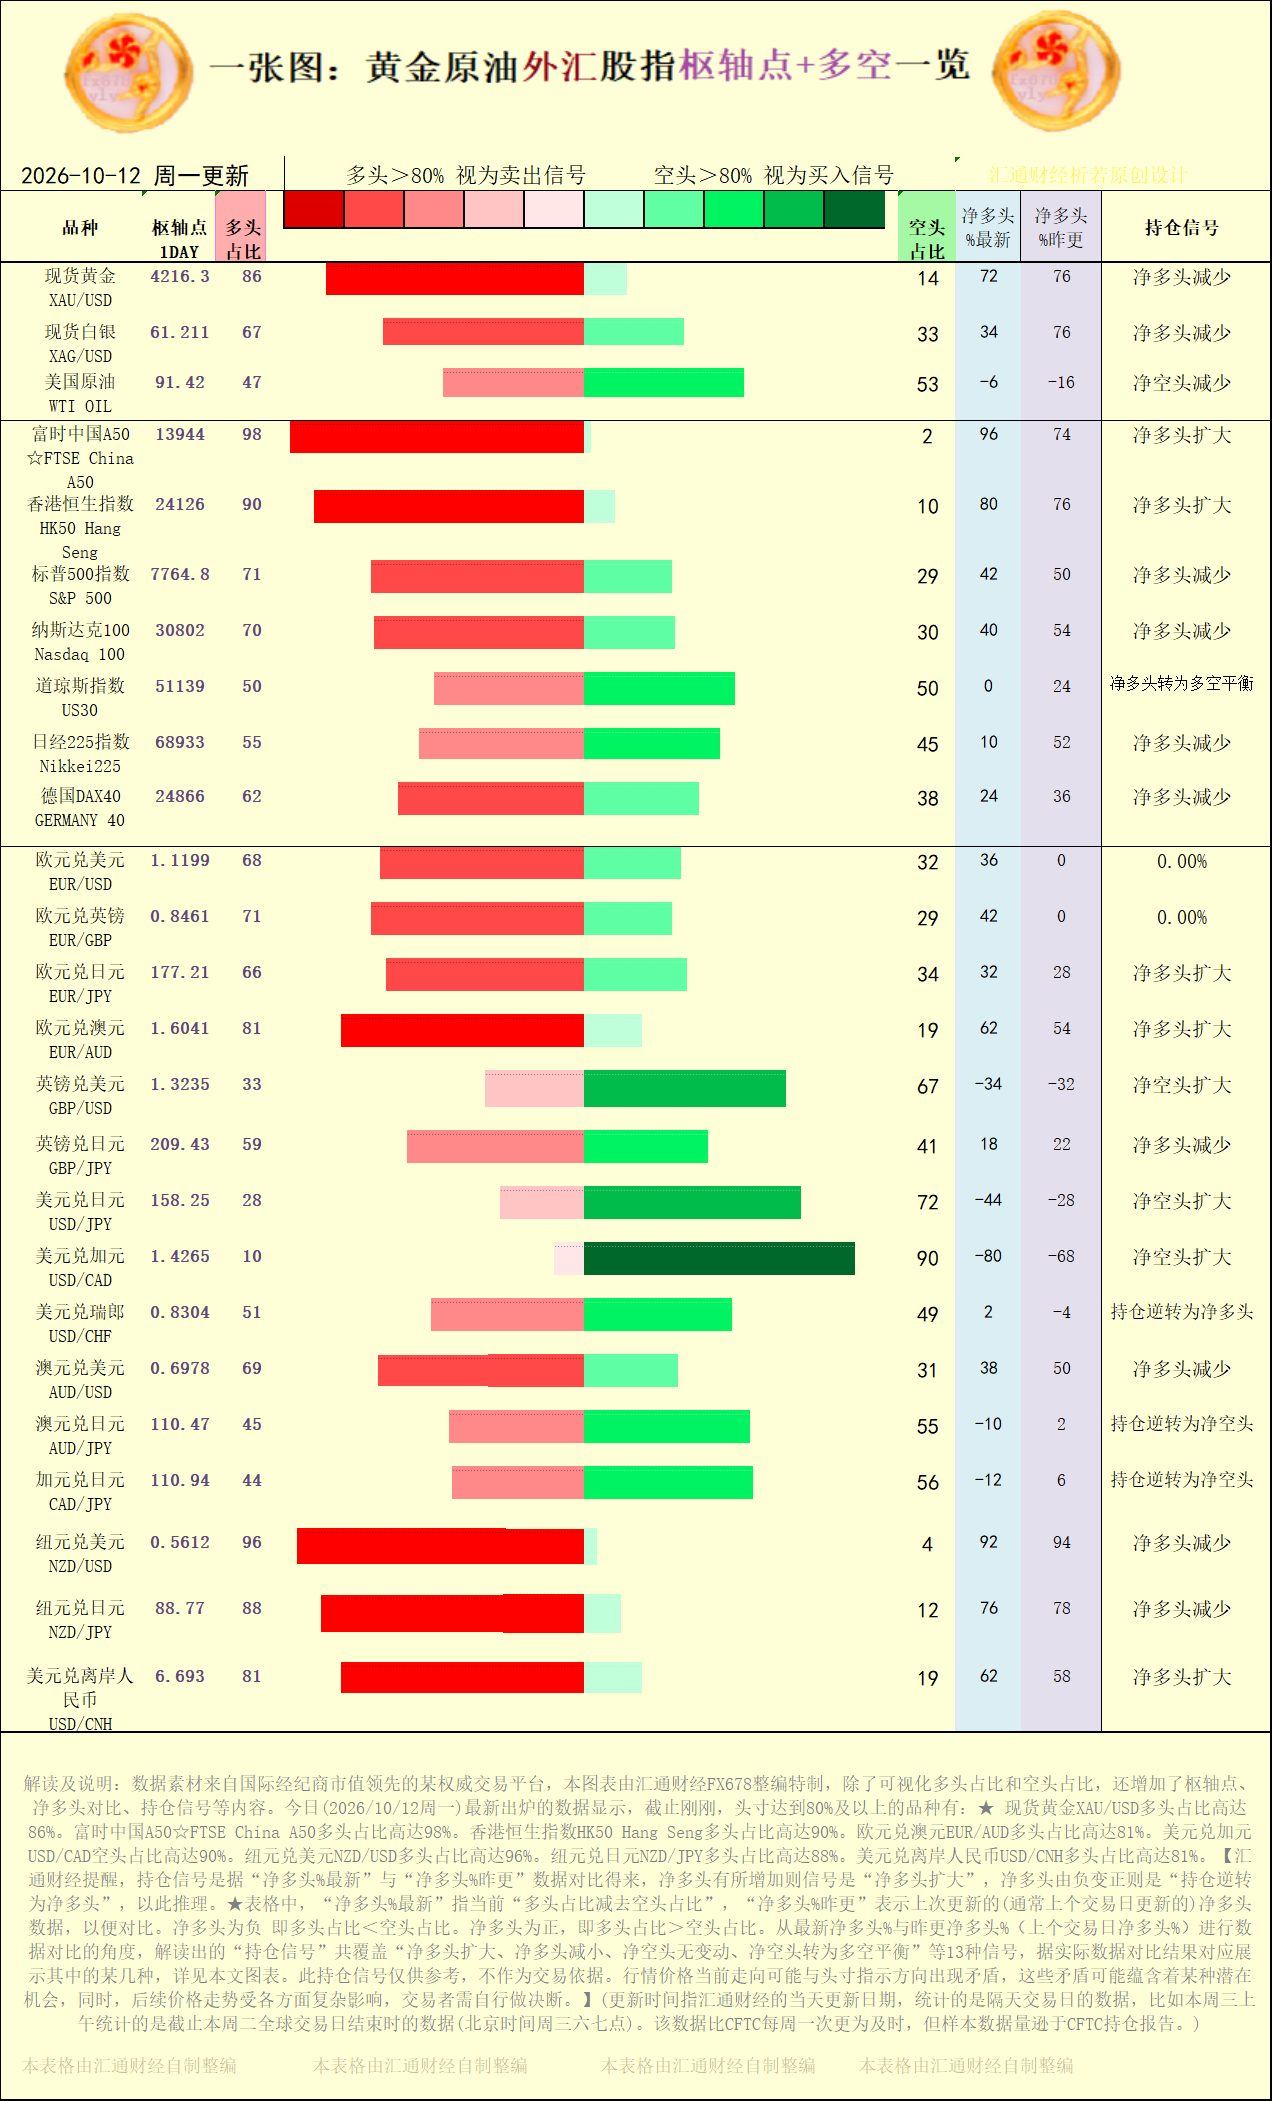 [Chart: Pivot Points and Long/Short Position Signals for Gold, Crude Oil, Forex, and Stock Indices, Source: FX678 Special Chart. (Click image to enlarge)] [Net short positions decreased in: US WTI Crude Oil] [Net long positions increased in: FTSE China A50, HK50 Hang Seng Index, EUR/JPY, EUR/AUD, and USD/CNH] [The following pairs saw a decrease in net long positions: Spot Gold (XAU/USD), Spot Silver (XAG/USD), S&P 500, Nasdaq 100, Nikkei 225, DAX 40, GBP/JPY, AUD/USD, NZD/USD, and NZD/JPY.] [FX168 reminds you that the position signal is derived by comparing the "Latest Net Long Position %" with the "Yesterday's Net Long Position %". An increase in net long positions indicates "expansion of net long positions", while a change from negative to positive indicates "reversal to net long positions". ★In the table, "Latest Net Long Position %" refers to the current "long position percentage minus short position percentage", and "Yesterday's Net Long Position %" represents the last updated (usually the previous trading day's) net long position data for comparison.] A negative net long position means the percentage of long positions is less than the percentage of short positions. A positive net long position means the percentage of long positions is greater than the percentage of short positions. By comparing the latest net long position percentage with the previous trading day's net long position percentage, the resulting "position signals" cover 13 types, including "net long position expansion, net long position decrease, net short position unchanged, and net short position turning into a balance between long and short positions." Some of these signals are shown in the charts in this article based on actual data comparison results. These position signals are for reference only and should not be used as the basis for trading decisions. The current price movement may contradict the direction indicated by the position signals. These contradictions may contain potential opportunities. Furthermore, subsequent price movements are influenced by various complex factors, and traders must make their own decisions. The trading instruments covered in this chart include: spot gold, spot silver, US crude oil, FTSE China A50, Hong Kong Hang Seng Index, S&P 500 Index, Nasdaq 100, Dow Jones Index, German DAX 40, EUR/USD, EUR/GBP, EUR/JPY, EUR/AUD, GBP/USD, GBP/JPY, USD/JPY, USD/CAD, USD/CHF, AUD/USD, AUD/JPY, CAD/JPY, and NZD/USD.
[Chart: Pivot Points and Long/Short Position Signals for Gold, Crude Oil, Forex, and Stock Indices, Source: FX678 Special Chart. (Click image to enlarge)] [Net short positions decreased in: US WTI Crude Oil] [Net long positions increased in: FTSE China A50, HK50 Hang Seng Index, EUR/JPY, EUR/AUD, and USD/CNH] [The following pairs saw a decrease in net long positions: Spot Gold (XAU/USD), Spot Silver (XAG/USD), S&P 500, Nasdaq 100, Nikkei 225, DAX 40, GBP/JPY, AUD/USD, NZD/USD, and NZD/JPY.] [FX168 reminds you that the position signal is derived by comparing the "Latest Net Long Position %" with the "Yesterday's Net Long Position %". An increase in net long positions indicates "expansion of net long positions", while a change from negative to positive indicates "reversal to net long positions". ★In the table, "Latest Net Long Position %" refers to the current "long position percentage minus short position percentage", and "Yesterday's Net Long Position %" represents the last updated (usually the previous trading day's) net long position data for comparison.] A negative net long position means the percentage of long positions is less than the percentage of short positions. A positive net long position means the percentage of long positions is greater than the percentage of short positions. By comparing the latest net long position percentage with the previous trading day's net long position percentage, the resulting "position signals" cover 13 types, including "net long position expansion, net long position decrease, net short position unchanged, and net short position turning into a balance between long and short positions." Some of these signals are shown in the charts in this article based on actual data comparison results. These position signals are for reference only and should not be used as the basis for trading decisions. The current price movement may contradict the direction indicated by the position signals. These contradictions may contain potential opportunities. Furthermore, subsequent price movements are influenced by various complex factors, and traders must make their own decisions. The trading instruments covered in this chart include: spot gold, spot silver, US crude oil, FTSE China A50, Hong Kong Hang Seng Index, S&P 500 Index, Nasdaq 100, Dow Jones Index, German DAX 40, EUR/USD, EUR/GBP, EUR/JPY, EUR/AUD, GBP/USD, GBP/JPY, USD/JPY, USD/CAD, USD/CHF, AUD/USD, AUD/JPY, CAD/JPY, and NZD/USD.
- Risk Warning and Disclaimer
- The market involves risk, and trading may not be suitable for all investors. This article is for reference only and does not constitute personal investment advice, nor does it take into account certain users’ specific investment objectives, financial situation, or other needs. Any investment decisions made based on this information are at your own risk.