The strengthening of the US dollar has widened the divergence between it and US Treasury yields.
2026-10-12 18:42:18
The US dollar is about to face a week packed with economic data, with key figures such as the Consumer Price Index (CPI), Producer Price Index (PPI), and retail sales data to be released on Wednesday and Thursday. While these figures will be the focus of the market, what is even more noteworthy is the sudden breakdown of the correlation between the US dollar and US short-term Treasury yields.  For most of the year, the two maintained a positive correlation, but the correlation deteriorated sharply in October. Even though the sharp rise in US Treasury yields in September has partially subsided, and market expectations for further Fed rate hikes have cooled, the dollar has continued to strengthen. If the French debt crisis hadn't put significant pressure on the euro, the dollar might already be significantly lower. The correlation between the dollar index and US Treasury yields has broken down. As can be seen from the chart below, the correlation between the dollar and US short-term Treasury yields has worsened. At the end of September, the 10-period rolling correlation coefficient between the dollar index and the US two-year Treasury yield was +0.66, and the 20-period rolling correlation coefficient was +0.55. By the end of last week, these two sets of data had fallen to -0.39 and +0.19, respectively.
 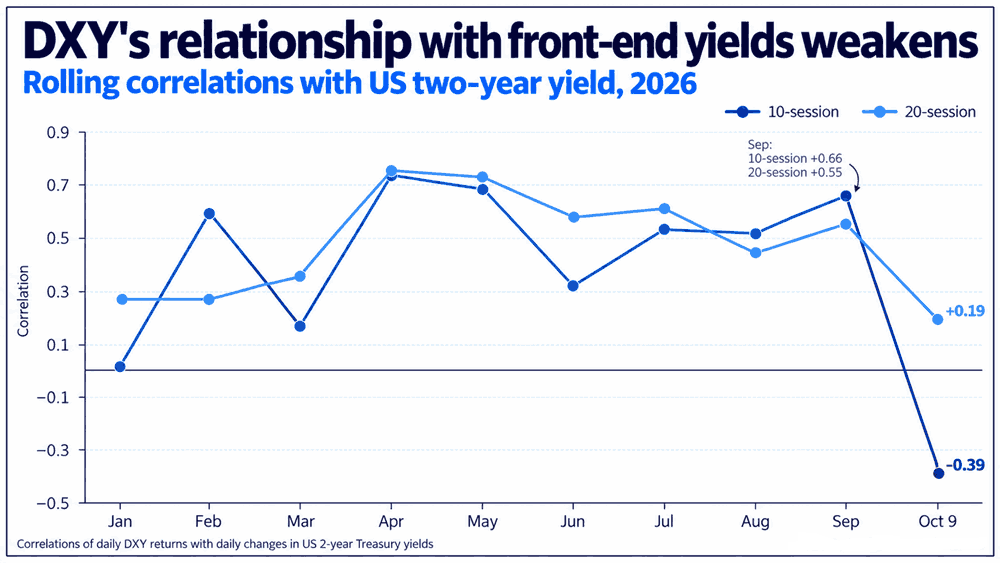 The five-year US Treasury yield also showed a similar trend, indicating that this correlation is not limited to short-term yields. Since the end of September, the US dollar index has risen by about 0.75%; while during the same period, the yield on the two-year US Treasury note has fallen by 9.6 basis points, and the yield on the five-year US Treasury note has fallen by 6.8 basis points. Despite cooling expectations for a Fed rate hike, the dollar remains steadfast . Earlier this month, weaker-than-expected US non-farm payroll data, coupled with signals from Fed officials, dampened market expectations for another rate hike in October, and the market has already lowered its pricing for further tightening. As shown in the chart below, the market's calculation of cumulative rate hikes by the end of next year has fallen from slightly over 100 basis points in mid-September to about 80 basis points. If the dollar had maintained the positive correlation with short-term US Treasury yields from earlier this year, then, all other things being equal, the dollar should be weaker than it is now. However, exchange rate movements are not solely driven by domestic US factors. Renewed market concerns about France's fiscal situation may spread to other European debt markets, and coupled with rising energy prices, multiple factors are putting downward pressure on the euro. The euro accounts for 57.6% of the US dollar index. A weaker euro explains why the dollar remains resilient even as expectations of a US interest rate hike have subsided. CPI data may cause volatility, but the direction is uncertain. This week is packed with important US economic data, but historical trends make it difficult to predict the dollar's direction. Looking back at the market movements following 188 CPI data releases since 2011: dollar volatility typically amplifies on the day of inflation data releases, but there is no reliable evidence that the dollar will continue its previous trend or reverse its existing trajectory. This means that traders, in addition to closely monitoring upcoming US economic data, also need to pay close attention to the dynamics of the European debt market, which will also significantly determine the dollar's future direction. US Dollar Index: Bullish continuation pattern gradually taking shape The US dollar index is consolidating after a strong rally that began in early September, a rally fueled by a significant upward revision of market expectations for further tightening by the Federal Reserve.
 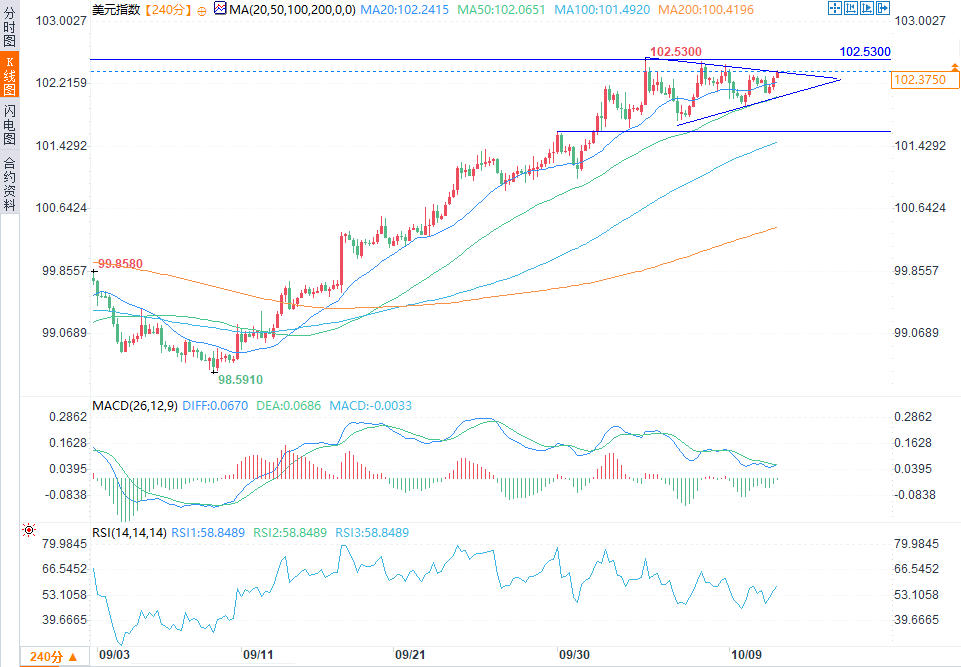 (US Dollar Index 4-hour chart source: FX678) Regardless of whether the current pattern is called a symmetrical triangle or a bullish flagpole pattern, the price has tested both sides of the pattern multiple times. As bullish momentum weakens, the trading range continues to narrow. The 14-period RSI is above the 50 neutral line, indicating that the bulls still dominate; however, it has not entered the overbought zone above 70. The DIFF and DEA lines are still running above the zero axis, indicating that the bullish trend remains intact, but short-term upward momentum is insufficient, and the bulls and bears are temporarily in a balanced oscillation. Combined with the previous upward trend, this technical pattern suggests a high probability of an upward breakout, but the price must stand above the upper rail of the pattern to confirm the bullish signal. The upper rail of the pattern is currently slightly below 102.50; the upward trend support level is below 102.00. After breaking through the above levels, the high of this month at 102.535 will become the first key level to watch for further upward movement. If the price holds above 102.535, the bullish continuation logic will be further strengthened, potentially pushing it towards 103.35. This level previously acted as both support and resistance in late 2024 and early 2025. Further up, the March 2025 high of 104.68 is the next important resistance level. On the downside, the June 2024 high of 101.80 saw buying support on the two previous tests of this level. Further down, 101.60 is another key level, having acted as resistance earlier this year. A break below 101.60 would target the late September low of 101.026.
For most of the year, the two maintained a positive correlation, but the correlation deteriorated sharply in October. Even though the sharp rise in US Treasury yields in September has partially subsided, and market expectations for further Fed rate hikes have cooled, the dollar has continued to strengthen. If the French debt crisis hadn't put significant pressure on the euro, the dollar might already be significantly lower. The correlation between the dollar index and US Treasury yields has broken down. As can be seen from the chart below, the correlation between the dollar and US short-term Treasury yields has worsened. At the end of September, the 10-period rolling correlation coefficient between the dollar index and the US two-year Treasury yield was +0.66, and the 20-period rolling correlation coefficient was +0.55. By the end of last week, these two sets of data had fallen to -0.39 and +0.19, respectively. The five-year US Treasury yield also showed a similar trend, indicating that this correlation is not limited to short-term yields. Since the end of September, the US dollar index has risen by about 0.75%; while during the same period, the yield on the two-year US Treasury note has fallen by 9.6 basis points, and the yield on the five-year US Treasury note has fallen by 6.8 basis points. Despite cooling expectations for a Fed rate hike, the dollar remains steadfast . Earlier this month, weaker-than-expected US non-farm payroll data, coupled with signals from Fed officials, dampened market expectations for another rate hike in October, and the market has already lowered its pricing for further tightening. As shown in the chart below, the market's calculation of cumulative rate hikes by the end of next year has fallen from slightly over 100 basis points in mid-September to about 80 basis points. If the dollar had maintained the positive correlation with short-term US Treasury yields from earlier this year, then, all other things being equal, the dollar should be weaker than it is now. However, exchange rate movements are not solely driven by domestic US factors. Renewed market concerns about France's fiscal situation may spread to other European debt markets, and coupled with rising energy prices, multiple factors are putting downward pressure on the euro. The euro accounts for 57.6% of the US dollar index. A weaker euro explains why the dollar remains resilient even as expectations of a US interest rate hike have subsided. CPI data may cause volatility, but the direction is uncertain. This week is packed with important US economic data, but historical trends make it difficult to predict the dollar's direction. Looking back at the market movements following 188 CPI data releases since 2011: dollar volatility typically amplifies on the day of inflation data releases, but there is no reliable evidence that the dollar will continue its previous trend or reverse its existing trajectory. This means that traders, in addition to closely monitoring upcoming US economic data, also need to pay close attention to the dynamics of the European debt market, which will also significantly determine the dollar's future direction. US Dollar Index: Bullish continuation pattern gradually taking shape The US dollar index is consolidating after a strong rally that began in early September, a rally fueled by a significant upward revision of market expectations for further tightening by the Federal Reserve. (US Dollar Index 4-hour chart source: FX678) Regardless of whether the current pattern is called a symmetrical triangle or a bullish flagpole pattern, the price has tested both sides of the pattern multiple times. As bullish momentum weakens, the trading range continues to narrow. The 14-period RSI is above the 50 neutral line, indicating that the bulls still dominate; however, it has not entered the overbought zone above 70. The DIFF and DEA lines are still running above the zero axis, indicating that the bullish trend remains intact, but short-term upward momentum is insufficient, and the bulls and bears are temporarily in a balanced oscillation. Combined with the previous upward trend, this technical pattern suggests a high probability of an upward breakout, but the price must stand above the upper rail of the pattern to confirm the bullish signal. The upper rail of the pattern is currently slightly below 102.50; the upward trend support level is below 102.00. After breaking through the above levels, the high of this month at 102.535 will become the first key level to watch for further upward movement. If the price holds above 102.535, the bullish continuation logic will be further strengthened, potentially pushing it towards 103.35. This level previously acted as both support and resistance in late 2024 and early 2025. Further up, the March 2025 high of 104.68 is the next important resistance level. On the downside, the June 2024 high of 101.80 saw buying support on the two previous tests of this level. Further down, 101.60 is another key level, having acted as resistance earlier this year. A break below 101.60 would target the late September low of 101.026.
- Risk Warning and Disclaimer
- The market involves risk, and trading may not be suitable for all investors. This article is for reference only and does not constitute personal investment advice, nor does it take into account certain users’ specific investment objectives, financial situation, or other needs. Any investment decisions made based on this information are at your own risk.