The rebound in oil prices has exacerbated inflation concerns, suppressing silver prices and causing them to continue to weaken. Be wary of a breakout.
2026-10-14 15:40:18
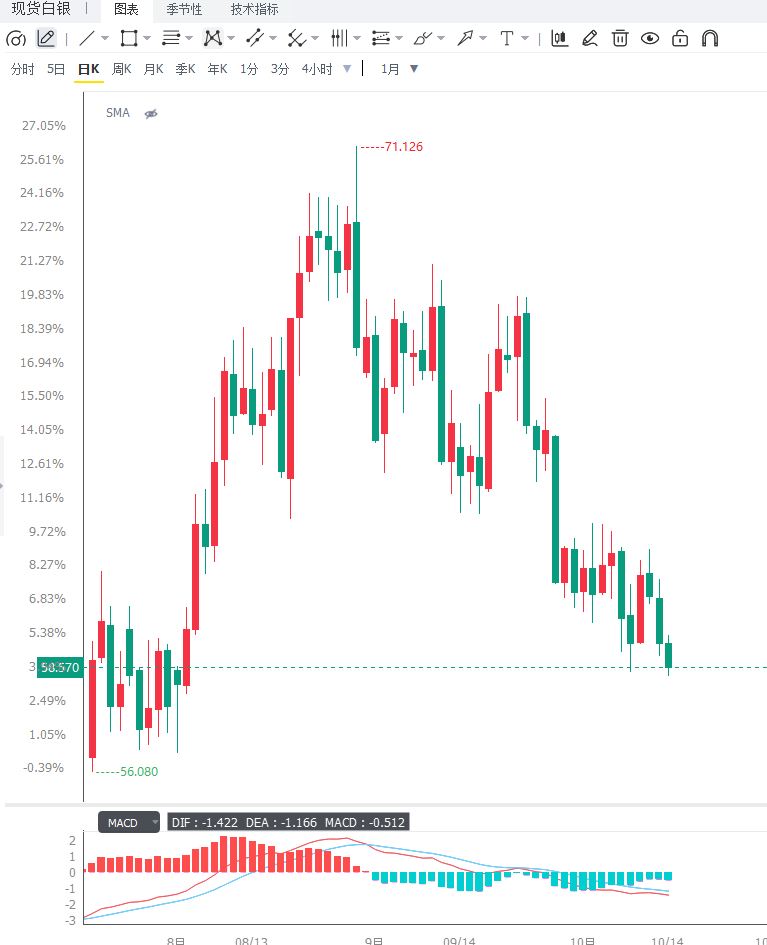
After a brief rebound last Friday, spot silver came under renewed pressure, falling 0.65% to around $58.70 per ounce during Wednesday's European session. COMEX silver futures also fell in tandem to around $59, briefly touching an intraday low of $58.40. Silver prices have hit a new one-week low, accumulating a rapid decline of approximately 5% within the week, and a death cross pattern has formed on the 1-hour chart. A total of $7.9628 million flowed out of spot silver on the day, indicating a clear signal of long positions being closed out.  The core driver of pressure on silver stems from the inflationary chain reaction triggered by the continued rise in oil prices. A recent report from Commerzbank noted that "the Houthi attacks on Saudi infrastructure and the continued diversion of oil tankers in the Persian Gulf have exacerbated market concerns about the reliability of Middle Eastern supplies," pushing oil prices to continue their recent rebound. WTI crude oil prices rebounded from a six-week low of $86.32 last week to around $93.44, a cumulative increase of 7.5%, although they fell slightly by 0.5% on Wednesday. The deadly attacks on Riyadh airport, Saudi Arabia's capital, prompted Saudi Arabia to vow retaliation, and US President Trump considered joining military strikes against the Houthis, keeping geopolitical risk premiums high. Rising oil prices have created a unique "inflationary bearish" transmission chain for silver. Higher energy costs directly push up global inflation expectations, strengthening the rationale for central banks to maintain or even intensify tightening policies, pushing US Treasury yields to remain high—the 10-year US Treasury yield remains near a multi-year high of 5.22%. For assets like silver that don't generate interest income, higher real interest rates mean a greater opportunity cost of holding them, causing funds to flow from silver to yield-generating bonds. Danske Bank analysts noted in a recent report that "for the Federal Reserve, the focus will be on whether underlying inflationary pressures are widening." The bank expects overall CPI to rise 0.5% month-on-month and 3.6% year-on-year in September, while core CPI will rise 0.2% month-on-month and 2.5% year-on-year, with energy prices being the main driver of overall inflation. Danske Bank emphasized that given "recent Fed communications indicating no urgency for another rate hike," "a significant upward surprise would be needed to prompt the Fed to signal an October rate hike." The recent flurry of statements from Fed officials further highlights the complexity of the policy path. New York Fed President Williams stated clearly on Tuesday that another rate hike this year would be appropriate, but further tightening is unnecessary in 2027. He pointed out that the Middle East conflict has driven up energy prices, which is being transmitted to core inflation through transportation, food, and other channels. Demand for data centers and chips driven by AI construction is also pushing up the cost of some goods. However, inflation expectations remain stable, and inflation is expected to "significantly decline" and approach the 2% target next year. Williams' speech received a tracking score of only 3.4 out of 10, far below his historical average of 5.8, releasing one of the clearest dovish signals in this tightening cycle. The Fed sentiment index fell 3.09 points to 133.86 that day, still above the 100 neutral line, but showing a meaningful softening at the margin. However, the hawkish stance of other Fed officials did not waver. Boston Fed President Collins stated that another rate hike before the end of the year would be appropriate; Chicago Fed President Goolsby warned that rising costs from AI data center construction are spreading to a wider range of sectors; Cleveland Fed President Hammark bluntly stated that inflationary pressures have extended beyond the energy sector, and some companies are planning to raise product prices at a rate higher than the increase in input costs. The CME Group's FedWatch Tool shows only a 17% to 20% probability of an October rate hike, but a high 84% to 88% probability of a December hike. Macquarie Group's foreign exchange strategist, Wiesman, stated that the upcoming September CPI data is expected to accelerate, "but is unlikely to prompt a Fed rate hike in October," as several officials have indicated a preference for a "rate hike every other meeting" pace. CIBC's chief economist, Shenfield, holds a different view, predicting a 0.3% month-on-month increase in core CPI and believing the Fed will raise rates this month, arguing that "too many items are still growing at rates exceeding 3%." From the perspective of silver's own market structure, it is currently in a rare "double dilemma." Goldman Sachs commodity trading desk analyst Robert Quinn pointed out in a recent report that silver is facing a stalemate where positive news is failing to push up prices, while negative factors continue to suppress the market. Between September 29 and October 7, Goldman Sachs' data center basket rose 4.2% and its solar basket rose 2.4%. Historically, this should have attracted speculative funds back to silver, but silver actually fell 1.4% during the same period. This was due to the US dollar index rising 0.8% to 102.5 during the same period, and real interest rates rising slightly. Trend-following CTA funds reversed their net long positions in silver from approximately $1.2 billion to a net short position of approximately -$1.4 billion within five weeks, reaching a net short position of at least a one-year high. The 25-delta put/call skew has risen to the top 2% of the two-year percentile, and the 3-month implied volatility has plummeted from over 100% at its January peak to approximately 33%. Senior commodity strategist Mike McGlone issued a stern warning, believing that after its historic surge to over $120 at the beginning of the year, silver may be confined to a wide range of $50 to $84 per ounce for the next few years. McGraw points out that silver's 260-day volatility is currently 5.1 times that of the S&P 500, reaching its highest relative level since 1980. He also notes the risk of further declines in silver, with a 10-year mean reversion price of approximately $31 per ounce. Historically, after the two surges in 1980 and 2011, silver only truly bottomed out after falling to $3.60 in 1993 and $11.60 in 2020, respectively. However, from the perspective of position asymmetry, when CTA short positions reach extremes and option skew is extreme, a stabilization and rebound in silver may not require significant positive news; it only requires that negative news cease to intensify. The US September CPI data, to be released tonight at 8:30 PM, will be the next major test for silver. The market expects the overall CPI to rise from 3.4% year-on-year to 3.6%, with a month-on-month increase of 0.6%, the largest increase in five months; the core CPI is expected to rise 0.2% month-on-month and 2.5% year-on-year. There is significant divergence in core CPI forecasts – Deutsche Bank's most conservative estimate is 0.16%, while Goldman Sachs, Barclays, and Morgan Stanley predict 0.24%. Bank of America economist Juno explicitly stated that a 0.2% month-on-month core CPI increase would not raise expectations of a rate hike, but a 0.3% increase could reignite speculation about an October rate hike. Stronger-than-expected inflation data could push up expectations of a December rate hike and increase the dollar and US Treasury yields, putting new selling pressure on silver. Conversely, moderate data could alleviate rate hike concerns, providing silver with more room for a rebound. From a technical perspective, silver continues its downward trend on the daily chart, with the price consistently trading below the 20-day exponential moving average around $61.45, which has now become immediate resistance, maintaining a bearish bias. The price is also below both the 50-day and 200-day simple moving averages, indicating a well-established medium- to long-term bearish structure. The Relative Strength Index (RSI) for the 14-day period was approximately 37.49, in the weak zone below the 50 neutral line, but not yet in the typical oversold range, indicating that selling pressure is still continuing but is approaching a level where selling pressure may begin to exhaust. The MACD indicator on the daily chart is releasing a bullish signal, but multiple indicators such as KDJ, RSI, SAR, CCI, and GJ are releasing bearish signals, indicating a clear divergence between bullish and bearish signals. The Bollinger Band middle line at approximately $62.29 forms the first resistance level for a short-term rebound. On the upside, the 20-day EMA at approximately $61.45 is a key watershed; a sustained daily close above this level is needed to alleviate the current bearish pressure. Subsequently, attention should be paid to the 50-day EMA near $63.39 and the resistance trendline near $65—multiple institutions agree that $65 is a crucial threshold for confirming a genuine stabilization and rebound in silver; only a break above this level can open up room for a rebound towards $70 and even higher. On the downside, the lower Bollinger Band at around $57.42 forms the most immediate line of defense; if it breaks down effectively, the $55.50 level will come into view; deeper support lies at the $50 psychological level – which is what McGraw refers to as the "first good support level" and a potential landing zone for long-term mean reversion.
  Editor's Summary: Silver is currently at a critical juncture where "the negative impact of oil price inflation transmission" and "extreme positioning brewing a reversal" converge. The ongoing Middle East conflict has driven oil prices up by over 7.5%, systematically suppressing silver through a transmission chain of "rising oil prices → increased inflation expectations → strengthened interest rate pricing → rising real interest rates," trapping it in the rare predicament of "no rise on positive news, sharp drop on negative news." However, CTA net short positions hitting a one-year high, option put skew at a two-year extreme, and implied volatility near a one-year low—these extreme positioning signals suggest that a silver rebound may not require significant positive news; it only needs the negative factors to stop escalating. Tonight's US CPI data will be the decisive variable for short-term direction: a moderate core CPI (0.2% or below) will alleviate concerns about interest rate hikes, and silver prices are expected to challenge the 20-day EMA at $61.45, with a potential target of $63 to $65 after a breakout; a stronger core CPI (0.3% or above) may reignite hawkish expectations, and silver prices face the risk of falling below $59 and correcting towards $57.42 or even $55.50. In the medium to long term, the World Silver Institute predicts that the global silver deficit will widen to 46.3 million ounces by 2026 (the sixth consecutive year of shortage). Structural demand increases from AI data centers and electric vehicles will provide bottom support, but the long-term predicament of $50 to $84 warned by Maglon and the gravitational pull of the 10-year average of $31 should not be ignored. Until the key $65 threshold is effectively broken, the medium-term bearish trend for silver is unlikely to reverse.
The core driver of pressure on silver stems from the inflationary chain reaction triggered by the continued rise in oil prices. A recent report from Commerzbank noted that "the Houthi attacks on Saudi infrastructure and the continued diversion of oil tankers in the Persian Gulf have exacerbated market concerns about the reliability of Middle Eastern supplies," pushing oil prices to continue their recent rebound. WTI crude oil prices rebounded from a six-week low of $86.32 last week to around $93.44, a cumulative increase of 7.5%, although they fell slightly by 0.5% on Wednesday. The deadly attacks on Riyadh airport, Saudi Arabia's capital, prompted Saudi Arabia to vow retaliation, and US President Trump considered joining military strikes against the Houthis, keeping geopolitical risk premiums high. Rising oil prices have created a unique "inflationary bearish" transmission chain for silver. Higher energy costs directly push up global inflation expectations, strengthening the rationale for central banks to maintain or even intensify tightening policies, pushing US Treasury yields to remain high—the 10-year US Treasury yield remains near a multi-year high of 5.22%. For assets like silver that don't generate interest income, higher real interest rates mean a greater opportunity cost of holding them, causing funds to flow from silver to yield-generating bonds. Danske Bank analysts noted in a recent report that "for the Federal Reserve, the focus will be on whether underlying inflationary pressures are widening." The bank expects overall CPI to rise 0.5% month-on-month and 3.6% year-on-year in September, while core CPI will rise 0.2% month-on-month and 2.5% year-on-year, with energy prices being the main driver of overall inflation. Danske Bank emphasized that given "recent Fed communications indicating no urgency for another rate hike," "a significant upward surprise would be needed to prompt the Fed to signal an October rate hike." The recent flurry of statements from Fed officials further highlights the complexity of the policy path. New York Fed President Williams stated clearly on Tuesday that another rate hike this year would be appropriate, but further tightening is unnecessary in 2027. He pointed out that the Middle East conflict has driven up energy prices, which is being transmitted to core inflation through transportation, food, and other channels. Demand for data centers and chips driven by AI construction is also pushing up the cost of some goods. However, inflation expectations remain stable, and inflation is expected to "significantly decline" and approach the 2% target next year. Williams' speech received a tracking score of only 3.4 out of 10, far below his historical average of 5.8, releasing one of the clearest dovish signals in this tightening cycle. The Fed sentiment index fell 3.09 points to 133.86 that day, still above the 100 neutral line, but showing a meaningful softening at the margin. However, the hawkish stance of other Fed officials did not waver. Boston Fed President Collins stated that another rate hike before the end of the year would be appropriate; Chicago Fed President Goolsby warned that rising costs from AI data center construction are spreading to a wider range of sectors; Cleveland Fed President Hammark bluntly stated that inflationary pressures have extended beyond the energy sector, and some companies are planning to raise product prices at a rate higher than the increase in input costs. The CME Group's FedWatch Tool shows only a 17% to 20% probability of an October rate hike, but a high 84% to 88% probability of a December hike. Macquarie Group's foreign exchange strategist, Wiesman, stated that the upcoming September CPI data is expected to accelerate, "but is unlikely to prompt a Fed rate hike in October," as several officials have indicated a preference for a "rate hike every other meeting" pace. CIBC's chief economist, Shenfield, holds a different view, predicting a 0.3% month-on-month increase in core CPI and believing the Fed will raise rates this month, arguing that "too many items are still growing at rates exceeding 3%." From the perspective of silver's own market structure, it is currently in a rare "double dilemma." Goldman Sachs commodity trading desk analyst Robert Quinn pointed out in a recent report that silver is facing a stalemate where positive news is failing to push up prices, while negative factors continue to suppress the market. Between September 29 and October 7, Goldman Sachs' data center basket rose 4.2% and its solar basket rose 2.4%. Historically, this should have attracted speculative funds back to silver, but silver actually fell 1.4% during the same period. This was due to the US dollar index rising 0.8% to 102.5 during the same period, and real interest rates rising slightly. Trend-following CTA funds reversed their net long positions in silver from approximately $1.2 billion to a net short position of approximately -$1.4 billion within five weeks, reaching a net short position of at least a one-year high. The 25-delta put/call skew has risen to the top 2% of the two-year percentile, and the 3-month implied volatility has plummeted from over 100% at its January peak to approximately 33%. Senior commodity strategist Mike McGlone issued a stern warning, believing that after its historic surge to over $120 at the beginning of the year, silver may be confined to a wide range of $50 to $84 per ounce for the next few years. McGraw points out that silver's 260-day volatility is currently 5.1 times that of the S&P 500, reaching its highest relative level since 1980. He also notes the risk of further declines in silver, with a 10-year mean reversion price of approximately $31 per ounce. Historically, after the two surges in 1980 and 2011, silver only truly bottomed out after falling to $3.60 in 1993 and $11.60 in 2020, respectively. However, from the perspective of position asymmetry, when CTA short positions reach extremes and option skew is extreme, a stabilization and rebound in silver may not require significant positive news; it only requires that negative news cease to intensify. The US September CPI data, to be released tonight at 8:30 PM, will be the next major test for silver. The market expects the overall CPI to rise from 3.4% year-on-year to 3.6%, with a month-on-month increase of 0.6%, the largest increase in five months; the core CPI is expected to rise 0.2% month-on-month and 2.5% year-on-year. There is significant divergence in core CPI forecasts – Deutsche Bank's most conservative estimate is 0.16%, while Goldman Sachs, Barclays, and Morgan Stanley predict 0.24%. Bank of America economist Juno explicitly stated that a 0.2% month-on-month core CPI increase would not raise expectations of a rate hike, but a 0.3% increase could reignite speculation about an October rate hike. Stronger-than-expected inflation data could push up expectations of a December rate hike and increase the dollar and US Treasury yields, putting new selling pressure on silver. Conversely, moderate data could alleviate rate hike concerns, providing silver with more room for a rebound. From a technical perspective, silver continues its downward trend on the daily chart, with the price consistently trading below the 20-day exponential moving average around $61.45, which has now become immediate resistance, maintaining a bearish bias. The price is also below both the 50-day and 200-day simple moving averages, indicating a well-established medium- to long-term bearish structure. The Relative Strength Index (RSI) for the 14-day period was approximately 37.49, in the weak zone below the 50 neutral line, but not yet in the typical oversold range, indicating that selling pressure is still continuing but is approaching a level where selling pressure may begin to exhaust. The MACD indicator on the daily chart is releasing a bullish signal, but multiple indicators such as KDJ, RSI, SAR, CCI, and GJ are releasing bearish signals, indicating a clear divergence between bullish and bearish signals. The Bollinger Band middle line at approximately $62.29 forms the first resistance level for a short-term rebound. On the upside, the 20-day EMA at approximately $61.45 is a key watershed; a sustained daily close above this level is needed to alleviate the current bearish pressure. Subsequently, attention should be paid to the 50-day EMA near $63.39 and the resistance trendline near $65—multiple institutions agree that $65 is a crucial threshold for confirming a genuine stabilization and rebound in silver; only a break above this level can open up room for a rebound towards $70 and even higher. On the downside, the lower Bollinger Band at around $57.42 forms the most immediate line of defense; if it breaks down effectively, the $55.50 level will come into view; deeper support lies at the $50 psychological level – which is what McGraw refers to as the "first good support level" and a potential landing zone for long-term mean reversion. Editor's Summary: Silver is currently at a critical juncture where "the negative impact of oil price inflation transmission" and "extreme positioning brewing a reversal" converge. The ongoing Middle East conflict has driven oil prices up by over 7.5%, systematically suppressing silver through a transmission chain of "rising oil prices → increased inflation expectations → strengthened interest rate pricing → rising real interest rates," trapping it in the rare predicament of "no rise on positive news, sharp drop on negative news." However, CTA net short positions hitting a one-year high, option put skew at a two-year extreme, and implied volatility near a one-year low—these extreme positioning signals suggest that a silver rebound may not require significant positive news; it only needs the negative factors to stop escalating. Tonight's US CPI data will be the decisive variable for short-term direction: a moderate core CPI (0.2% or below) will alleviate concerns about interest rate hikes, and silver prices are expected to challenge the 20-day EMA at $61.45, with a potential target of $63 to $65 after a breakout; a stronger core CPI (0.3% or above) may reignite hawkish expectations, and silver prices face the risk of falling below $59 and correcting towards $57.42 or even $55.50. In the medium to long term, the World Silver Institute predicts that the global silver deficit will widen to 46.3 million ounces by 2026 (the sixth consecutive year of shortage). Structural demand increases from AI data centers and electric vehicles will provide bottom support, but the long-term predicament of $50 to $84 warned by Maglon and the gravitational pull of the 10-year average of $31 should not be ignored. Until the key $65 threshold is effectively broken, the medium-term bearish trend for silver is unlikely to reverse.
- Risk Warning and Disclaimer
- The market involves risk, and trading may not be suitable for all investors. This article is for reference only and does not constitute personal investment advice, nor does it take into account certain users’ specific investment objectives, financial situation, or other needs. Any investment decisions made based on this information are at your own risk.