Is the bond market pricing in a Federal Reserve policy mistake?
2026-10-21 23:28:20
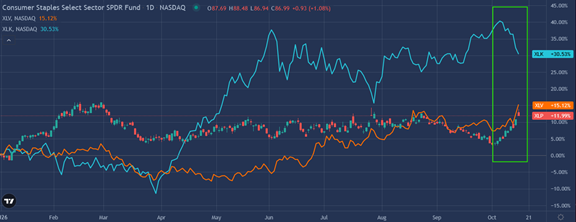
Imagine this: In early October, someone tells you through a crystal ball that the upcoming September CPI data will be higher than market expectations, with the Producer Price Index (PPI) rising by 1.3% that month, far exceeding the predicted 0.5%. Besides this negative inflationary news, the person also mentions that inflationary pressures are still brewing, and oil prices will rise by $10 in the first two weeks of the month. Based on this prediction, what level do you think the 10-year US Treasury yield will be at? For reference: On October 1st, the US 10-year Treasury yield was approaching 5.25%. We bet the vast majority of professional bond traders would bet on a yield of 5.50% or even higher.  Following the release of CPI data on October 14th, the 10-year US Treasury yield surged rapidly, reaching 5.33% within minutes of the data release. However, just a few days later, the yield significantly retreated to 5.03%. The 30-year US Treasury yield also experienced a similar decline. Faced with unexpectedly strong inflation, the bond market actually rallied. Mohamed El-Erian, former CEO of Pacific Investment Management Company (PIMCO) and a renowned bond expert, posed this seemingly obvious question on the social media platform X: Despite both CPI and PPI inflation data exceeding expectations, why are US Treasury yields still declining? He offered two logical explanations. This article will interpret his two AI-related analyses and supplement them with our own two points. The most important point is that the bond market may have already begun pricing in a risk—the Federal Reserve may be forced to make a policy mistake. Explanation 1: Funds are withdrawing from tech stocks and shifting to safe-haven assets El-Erian's first driving factor is the withdrawal of funds from previously rising but now pressured tech stocks, triggering safe-haven buying. Many semiconductor stocks continued to weaken. During the period from October 1st to 15th, when PPI data was released, the SOX semiconductor index fell by nearly 20%. The Nasdaq index, with its higher semiconductor weighting, also declined accordingly. Overseas markets also experienced significant drops, including the South Korean KOSPI and the Japanese Nikkei, both heavily weighted in technology stocks. As shown in the chart below, since October 1st, the healthcare sector (XLV), consumer staples sector (XLP), and other previously sold-off value sectors have seen gains, while the technology sector (XLK) has shown the opposite trend. This rotation is essentially a shift in risk aversion within the stock market, but El-Erian believes it has also spurred some buying of government bonds.
 In addition, El-Erian mentioned that the most vulnerable market sectors are experiencing credit pressures. For example, CoreWeave, a large data center service provider, saw its debt yield surge from 9% to 15%. Because investors are demanding such high yields on CoreWeave and its peers' bonds, the market is concerned that CoreWeave may become the "coal mine canary" (a warning sign) in the AI boom. Such credit risk events often prompt funds to shift from corporate bonds to US Treasury bonds, a typical hedging behavior. Explanation Two: Is Technology Still an Engine of Economic Growth? El-Erian's second point has broader macroeconomic implications: AI-related capital expenditure has always been a core driver of economic growth. If investors are no longer willing to fund AI expansion projects, and companies themselves are unable to afford the related investments, will the economic growth outlook weaken accordingly? Charlene Chanana of Saxo Bank stated: Investors are no longer willing to finance AI infrastructure expansion regardless of cost. With the 10-year US Treasury yield exceeding 5% and some AI-related credit spreads reaching junk bond levels, the financing costs for data centers have risen sharply. Contraction in AI capital expenditure means slower GDP growth, and declining growth expectations will further depress inflation expectations, ultimately pushing down long-term yields. Explanation 3: Short Covering and Strong Demand Signals Our first point, building on El-Erian's perspective, is short covering. Entering October, the bond market was generally betting on rising yields. Bloomberg, citing data from the Commodity Futures Trading Commission (CFTC), reported that in the week ending September 22, asset management firms added over 100,000 short positions in 10-year US Treasury futures, one of the largest weekly short-selling operations since 2023. Furthermore, in the 14 trading days of late September, open interest in 10-year Treasury futures increased on 13 days; while open interest in 5-year Treasury futures increased on 11 out of 12 trading days. This indicates that as yields rose, the market continued to build new short positions. The 10-year and 30-year US Treasury auctions on October 7 and 8 seemed to foreshadow this market reversal. Many investors had initially expected weak demand for newly issued Treasury bonds, but the opposite proved true. Quoting our commentary: Wednesday's auction of $39 billion in 10-year Treasury bonds yielded a maximum winning bid of 5.300%, 1.7 basis points lower than pre-auction market expectations, meaning the auction result was far better than anticipated. Thursday's auction of $22.5 billion in 30-year bonds showed a similar pattern. The chart below (box plot provided by ExanteData) shows that the bidding data for both auctions deviated significantly from historical norms. The bid-to-cover ratio represents the funds raised per dollar of newly issued bonds. The bid-to-cover ratio for the 10-year bonds was 2.77, with a 12-month average of 2.51, a new high in nearly 50 auctions; the bid-to-cover ratio for the 30-year bonds was 2.54, with a historical median of 2.40, placing it at the upper end of the range for the past 50 auctions. The participation of primary dealers was perhaps the most crucial indicator of this auction. Primary dealers of U.S. Treasury bonds are obligated to take on bonds that are not being purchased by the market. A high dealer participation rate indicates a lukewarm auction, forcing Wall Street to hold inventory. In this auction, primary dealers subscribed to only 2.5% of the 10-year Treasury bonds, marking the lowest subscription rate in the history of this type of bond; the subscription rate for 30-year bonds was 6.8%. Indirect bidders (mostly overseas central banks and domestic institutions) secured 80.3% and 72.3% of the shares respectively, far exceeding the historical average.
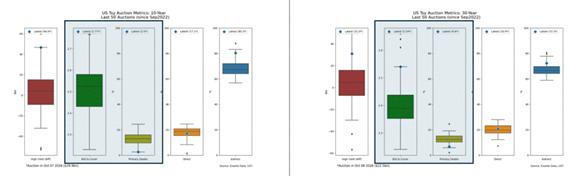 This auction demonstrates that primary dealers hardly needed to cover losses, indicating that genuine long-term funds were absorbing the supply of Treasury bonds at the current yield level. Although bond prices did not immediately surge upon the announcement of the strong auction results, this served as a warning to short sellers: market demand is extremely strong at yields above 5%. Strong buying prompted short sellers to buy Treasury bonds to cover their positions. Due to the highly crowded short positions, this buying and covering created a cyclical effect, forcing more short sellers to cover their positions. Explanation 4: The bond market senses the risk of a policy misstep . The bond market may be beginning to believe that this month's higher-than-expected inflation data will force the Federal Reserve to further raise interest rates, rather than lower them, ultimately leading to a policy misstep. The changes in the yield curve over the past two weeks confirm our judgment. On October 7th, the spread between 2-year and 10-year US Treasury yields was 57 basis points. After the release of CPI and PPI data, the spread narrowed to 32 basis points. The spread narrowed by 25 basis points within two weeks, with most of the change occurring on the day the inflation data was released. When all yields decline in tandem, with long-term yields falling more than short-term yields, this pattern is known as bull market flattening. If the market expects the Federal Reserve to continue tightening policy amid a weakening economy, funds will buy long-term bonds, pushing the yield curve flattening. Conversely, if the market fears runaway inflation, the yield curve will steepen in a bear market. The short end of the yield curve prices the probability of a Fed rate hike; the long end prices the economic consequences of such a hike. Reasons for Concern about Policy Mistakes Several reasons lead the bond market to worry about potential policy deviations by the Federal Reserve: First, the current inflation surge is largely due to supply shocks. Gasoline and diesel price increases stem from geopolitical conflicts related to Iran, not from overheated domestic consumption. The Fed cannot increase oil production, but it can suppress demand for all other goods. Second, the labor market has weakened. Non-farm payrolls increased by only 29,000 in September, with previous months' data revised down by a total of 60,000. Furthermore, the unemployment rate has risen to 4.2%, and real income is flat or even slightly declining, with little evidence of a wage-price spiral inflationary cycle. Third, consumers are under pressure. The latest retail sales data showed a 0.8% increase, better than expected, but the growth was mainly driven by gasoline consumption. Data from the Bureau of Economic Analysis's retail control group, used to calculate GDP, showed only a 0.1% increase. Essentially, rising oil prices squeezed consumer spending in other areas. Fourth, according to the Fed's own calculations, current monetary policy is already tightening. After the September rate hike, the federal funds rate reached 3.75%–4.00%, higher than the Fed's estimated long-term neutral rate of 3.20%. The median of the dot plot in the Fed's latest Summary of Economic Projections (SEP), coupled with statements from some Fed officials, indicates a high probability of one or two more rate hikes. Fifth, financial conditions are tightening. The 10-year Treasury yield is above 5%, the 30-year mortgage rate is close to 7.50%, the dollar is at an 18-month high, and credit spreads are widening—these factors themselves are already tightening the economy for the Fed. If the federal funds rate continues to rise, financial conditions will tighten further. The Hawkish Logic Objectively speaking, there are reasonable grounds for hawkish Fed officials to support continued rate hikes. The latest CPI data shows widespread price increases across a broad range of goods and services, with core PCE approaching 3%. More importantly, inflation has been above the Fed's target for over five years. The Fed has reason to worry about inflation expectations becoming unanchored. However, bond market pricing doesn't assess whether inflation is too high or what its past levels were, but rather its future trajectory and whether the Fed's anti-inflation measures, besides solving the inflation problem, will inadvertently trigger a recession. In summary , the fact that bond yields are declining despite strong inflation data is not a contradiction. It reflects multiple factors: capital flight from tech stocks leading to safe-haven buying, waning market confidence in AI growth engines, short covering, and strong demand in the Treasury market. In our view, the most important signal is that the market is concerned that the Fed is dealing with an energy-driven inflation shock, while inflation remains persistently high, leading to continued tightening of monetary policy during an economic slowdown. The shape of the yield curve and the direction of long-term yields are good indicators for predicting future developments.
Following the release of CPI data on October 14th, the 10-year US Treasury yield surged rapidly, reaching 5.33% within minutes of the data release. However, just a few days later, the yield significantly retreated to 5.03%. The 30-year US Treasury yield also experienced a similar decline. Faced with unexpectedly strong inflation, the bond market actually rallied. Mohamed El-Erian, former CEO of Pacific Investment Management Company (PIMCO) and a renowned bond expert, posed this seemingly obvious question on the social media platform X: Despite both CPI and PPI inflation data exceeding expectations, why are US Treasury yields still declining? He offered two logical explanations. This article will interpret his two AI-related analyses and supplement them with our own two points. The most important point is that the bond market may have already begun pricing in a risk—the Federal Reserve may be forced to make a policy mistake. Explanation 1: Funds are withdrawing from tech stocks and shifting to safe-haven assets El-Erian's first driving factor is the withdrawal of funds from previously rising but now pressured tech stocks, triggering safe-haven buying. Many semiconductor stocks continued to weaken. During the period from October 1st to 15th, when PPI data was released, the SOX semiconductor index fell by nearly 20%. The Nasdaq index, with its higher semiconductor weighting, also declined accordingly. Overseas markets also experienced significant drops, including the South Korean KOSPI and the Japanese Nikkei, both heavily weighted in technology stocks. As shown in the chart below, since October 1st, the healthcare sector (XLV), consumer staples sector (XLP), and other previously sold-off value sectors have seen gains, while the technology sector (XLK) has shown the opposite trend. This rotation is essentially a shift in risk aversion within the stock market, but El-Erian believes it has also spurred some buying of government bonds. In addition, El-Erian mentioned that the most vulnerable market sectors are experiencing credit pressures. For example, CoreWeave, a large data center service provider, saw its debt yield surge from 9% to 15%. Because investors are demanding such high yields on CoreWeave and its peers' bonds, the market is concerned that CoreWeave may become the "coal mine canary" (a warning sign) in the AI boom. Such credit risk events often prompt funds to shift from corporate bonds to US Treasury bonds, a typical hedging behavior. Explanation Two: Is Technology Still an Engine of Economic Growth? El-Erian's second point has broader macroeconomic implications: AI-related capital expenditure has always been a core driver of economic growth. If investors are no longer willing to fund AI expansion projects, and companies themselves are unable to afford the related investments, will the economic growth outlook weaken accordingly? Charlene Chanana of Saxo Bank stated: Investors are no longer willing to finance AI infrastructure expansion regardless of cost. With the 10-year US Treasury yield exceeding 5% and some AI-related credit spreads reaching junk bond levels, the financing costs for data centers have risen sharply. Contraction in AI capital expenditure means slower GDP growth, and declining growth expectations will further depress inflation expectations, ultimately pushing down long-term yields. Explanation 3: Short Covering and Strong Demand Signals Our first point, building on El-Erian's perspective, is short covering. Entering October, the bond market was generally betting on rising yields. Bloomberg, citing data from the Commodity Futures Trading Commission (CFTC), reported that in the week ending September 22, asset management firms added over 100,000 short positions in 10-year US Treasury futures, one of the largest weekly short-selling operations since 2023. Furthermore, in the 14 trading days of late September, open interest in 10-year Treasury futures increased on 13 days; while open interest in 5-year Treasury futures increased on 11 out of 12 trading days. This indicates that as yields rose, the market continued to build new short positions. The 10-year and 30-year US Treasury auctions on October 7 and 8 seemed to foreshadow this market reversal. Many investors had initially expected weak demand for newly issued Treasury bonds, but the opposite proved true. Quoting our commentary: Wednesday's auction of $39 billion in 10-year Treasury bonds yielded a maximum winning bid of 5.300%, 1.7 basis points lower than pre-auction market expectations, meaning the auction result was far better than anticipated. Thursday's auction of $22.5 billion in 30-year bonds showed a similar pattern. The chart below (box plot provided by ExanteData) shows that the bidding data for both auctions deviated significantly from historical norms. The bid-to-cover ratio represents the funds raised per dollar of newly issued bonds. The bid-to-cover ratio for the 10-year bonds was 2.77, with a 12-month average of 2.51, a new high in nearly 50 auctions; the bid-to-cover ratio for the 30-year bonds was 2.54, with a historical median of 2.40, placing it at the upper end of the range for the past 50 auctions. The participation of primary dealers was perhaps the most crucial indicator of this auction. Primary dealers of U.S. Treasury bonds are obligated to take on bonds that are not being purchased by the market. A high dealer participation rate indicates a lukewarm auction, forcing Wall Street to hold inventory. In this auction, primary dealers subscribed to only 2.5% of the 10-year Treasury bonds, marking the lowest subscription rate in the history of this type of bond; the subscription rate for 30-year bonds was 6.8%. Indirect bidders (mostly overseas central banks and domestic institutions) secured 80.3% and 72.3% of the shares respectively, far exceeding the historical average. This auction demonstrates that primary dealers hardly needed to cover losses, indicating that genuine long-term funds were absorbing the supply of Treasury bonds at the current yield level. Although bond prices did not immediately surge upon the announcement of the strong auction results, this served as a warning to short sellers: market demand is extremely strong at yields above 5%. Strong buying prompted short sellers to buy Treasury bonds to cover their positions. Due to the highly crowded short positions, this buying and covering created a cyclical effect, forcing more short sellers to cover their positions. Explanation 4: The bond market senses the risk of a policy misstep . The bond market may be beginning to believe that this month's higher-than-expected inflation data will force the Federal Reserve to further raise interest rates, rather than lower them, ultimately leading to a policy misstep. The changes in the yield curve over the past two weeks confirm our judgment. On October 7th, the spread between 2-year and 10-year US Treasury yields was 57 basis points. After the release of CPI and PPI data, the spread narrowed to 32 basis points. The spread narrowed by 25 basis points within two weeks, with most of the change occurring on the day the inflation data was released. When all yields decline in tandem, with long-term yields falling more than short-term yields, this pattern is known as bull market flattening. If the market expects the Federal Reserve to continue tightening policy amid a weakening economy, funds will buy long-term bonds, pushing the yield curve flattening. Conversely, if the market fears runaway inflation, the yield curve will steepen in a bear market. The short end of the yield curve prices the probability of a Fed rate hike; the long end prices the economic consequences of such a hike. Reasons for Concern about Policy Mistakes Several reasons lead the bond market to worry about potential policy deviations by the Federal Reserve: First, the current inflation surge is largely due to supply shocks. Gasoline and diesel price increases stem from geopolitical conflicts related to Iran, not from overheated domestic consumption. The Fed cannot increase oil production, but it can suppress demand for all other goods. Second, the labor market has weakened. Non-farm payrolls increased by only 29,000 in September, with previous months' data revised down by a total of 60,000. Furthermore, the unemployment rate has risen to 4.2%, and real income is flat or even slightly declining, with little evidence of a wage-price spiral inflationary cycle. Third, consumers are under pressure. The latest retail sales data showed a 0.8% increase, better than expected, but the growth was mainly driven by gasoline consumption. Data from the Bureau of Economic Analysis's retail control group, used to calculate GDP, showed only a 0.1% increase. Essentially, rising oil prices squeezed consumer spending in other areas. Fourth, according to the Fed's own calculations, current monetary policy is already tightening. After the September rate hike, the federal funds rate reached 3.75%–4.00%, higher than the Fed's estimated long-term neutral rate of 3.20%. The median of the dot plot in the Fed's latest Summary of Economic Projections (SEP), coupled with statements from some Fed officials, indicates a high probability of one or two more rate hikes. Fifth, financial conditions are tightening. The 10-year Treasury yield is above 5%, the 30-year mortgage rate is close to 7.50%, the dollar is at an 18-month high, and credit spreads are widening—these factors themselves are already tightening the economy for the Fed. If the federal funds rate continues to rise, financial conditions will tighten further. The Hawkish Logic Objectively speaking, there are reasonable grounds for hawkish Fed officials to support continued rate hikes. The latest CPI data shows widespread price increases across a broad range of goods and services, with core PCE approaching 3%. More importantly, inflation has been above the Fed's target for over five years. The Fed has reason to worry about inflation expectations becoming unanchored. However, bond market pricing doesn't assess whether inflation is too high or what its past levels were, but rather its future trajectory and whether the Fed's anti-inflation measures, besides solving the inflation problem, will inadvertently trigger a recession. In summary , the fact that bond yields are declining despite strong inflation data is not a contradiction. It reflects multiple factors: capital flight from tech stocks leading to safe-haven buying, waning market confidence in AI growth engines, short covering, and strong demand in the Treasury market. In our view, the most important signal is that the market is concerned that the Fed is dealing with an energy-driven inflation shock, while inflation remains persistently high, leading to continued tightening of monetary policy during an economic slowdown. The shape of the yield curve and the direction of long-term yields are good indicators for predicting future developments.
- Risk Warning and Disclaimer
- The market involves risk, and trading may not be suitable for all investors. This article is for reference only and does not constitute personal investment advice, nor does it take into account certain users’ specific investment objectives, financial situation, or other needs. Any investment decisions made based on this information are at your own risk.