The 10-year US Treasury yield fell below 5%, hitting a one-month low, with a single-day plunge of 17 basis points, reminiscent of the Silicon Valley Bank moment.
2026-10-23 09:48:21
The yield on the 10-year U.S. Treasury note fell below the key psychological level of 5% on Thursday (October 22), marking its most dramatic single-day decline since the Silicon Valley banking crisis in March 2023. As the "anchor of global asset pricing" and a benchmark for mortgage, auto loan, and credit card debt, its movement reversed the weeks-long sell-off narrative in a single day, forcefully shifting market attention from "runaway inflation" to "risk aversion." On Friday (October 23), the yield on the 10-year U.S. Treasury note hovered near a one-month low, currently trading around 4.961%. 
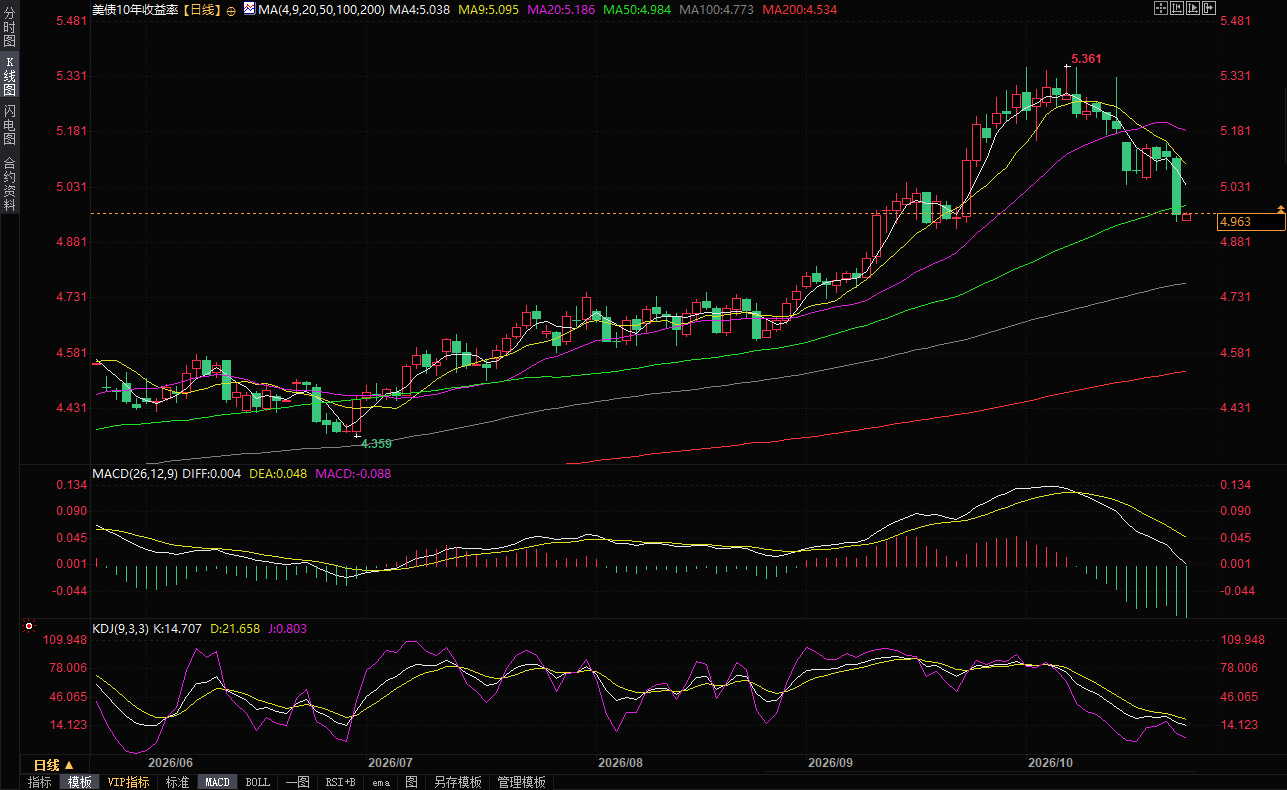 (Daily chart of the US 10-year Treasury yield, source: EasyTrade)
I. A broad-based plunge: A rare overall downward shift in the yield curve.
U.S. Treasury yields fell sharply across the entire curve during Thursday's New York trading session. The 10-year Treasury yield fell about 17 basis points to 4.953%, closing below 5% for the first time since September 23. The intraday drop approached 19 basis points at one point. Dow Jones market data shows this is the largest single-day drop in yield for this maturity since March 10, 2023, the day Silicon Valley Bank collapsed; in the past decade, the 10-year yield has only seen a single-day change of 19 basis points 15 times. The simultaneous decline at both short and long ends further confirms that this is a systemic shift towards safe-haven assets, rather than a simple repricing of inflation expectations. The 2-year yield, which is sensitive to the Federal Reserve's policy rate, fell more than 16 basis points to 4.64%, and the 30-year yield fell about 13 basis points to 5.279%. The yield curve between 2-year and 10-year maturities, which had flattened in recent weeks due to rising expectations of interest rate hikes, saw a synchronized decline on Thursday, indicating that the driving force behind the market has shifted from "higher and longer interest rates" to "bleeding of risk assets." Prior to this, the 10-year yield touched 5.3645% on October 7th, its highest level since April 2002. The dramatic shift in market sentiment from a more than two-decade high to a single-day plunge back below 5% constitutes a signal worth analyzing.II. Triggering Chain: The Triple Combination of AI Financing Anxiety, Meta Credit Risk, and Geopolitics
On the surface, Thursday's safe-haven buying was triggered by a stock market sell-off. The Nasdaq Composite Index plunged 694 points, or 2.60%, to close at 26,008.86, marking its biggest single-day drop since June; the Philadelphia Semiconductor Index plummeted 6.72%, Nvidia fell 4.40%, and AMD plunged 8.10%. However, the reasons for the stock market decline were not singular: the market was re-examining the financing structure of the expansion of artificial intelligence infrastructure and its spillover effects on the credit market. Meta became the focal point of this round of concerns. The company disclosed in its earnings report that its total future spending commitments had surged from $700 billion in July to $825 billion, and its quarterly free cash flow recorded its first negative figure in 14 years since its listing; the price of its five-year credit default swaps, which measures its credit risk, soared to its highest level since its listing, and its corporate bonds weakened significantly relative to U.S. Treasuries. Meta's simultaneous announcement of issuing new non-voting shares to finance its AI expansion has forced investors to question a previously overshadowed valuation frenzy: as mega-tech companies shift from "internal cash flow supporting capital expenditures" to "a combination of debt and equity financing supporting capital expenditures," is the creditworthiness of AI deals being systematically underestimated? Mitch Goldberg, president of ClientFirst Strategy, succinctly describes the situation: "People suddenly panicked about the massive bond issuances by AI-related companies. They saw interest rates rising and wanted to hold assets they believed would still be redeemable at maturity." Nvidia CEO Jensen Huang told CNBC on the same day that demand for dedicated AI cloud infrastructure was "exploding," but capital was scarce—a statement that itself suggests the consensus in the AI narrative that "demand is not a problem" is facing real constraints on financing conditions. Geopolitics, on the other hand, is exerting pressure in the same direction. Reports that the US and Israel are considering resuming strikes against Iran after the November midterm elections sent WTI crude futures up 2.39% to $99.47 a barrel and Brent crude surging 4% to $113.17 a barrel. High oil prices should have been a negative for bonds—raising inflation expectations and reinforcing central bank tightening pressures—but the market on Thursday opted to temporarily set aside this logic, instead viewing geopolitical uncertainty itself as a negative factor for holding risky assets. As Gregory Faranello, head of US macro strategy at South Street Securities, put it: “You always want to find a risk point, but there isn’t just one right now… If you had to pick the most important one, it would definitely be what’s happening on the geopolitical front.”III. The Dual Meaning of 5%: Resistance Level or Entry Point
The same yield level has played drastically opposite roles in the market narrative. Earlier this month, 5% was interpreted as proof of sticky inflation and fiscal supply pressure, and the continued rise in yields reinforced expectations of a return to the "bond vigilante" mentality. However, after falling below 5% on Thursday, 5% was quickly redefined as an attractive valuation level that "provides sufficient compensation even if inflation is above 3%." This reversal is closely related to positioning. Goldman Sachs and Morgan Stanley had already shifted their recommendation to increase exposure to US Treasury duration in early October when yields were at multi-year highs, citing the emergence of credit market stress signals and the fact that yields already had allocation value under the nominal GDP growth assumption, respectively. Thursday's safe-haven buying was, to some extent, a post-hoc confirmation of these left-side judgments rather than pricing in entirely new information. However, this cautious interpretation is also supported by data. The latest breakeven inflation rate for 10-year TIPS is 2.333%, meaning that the market's priced-in average inflation expectation for the next ten years is only about 2.3%, while current overall inflation is still above 3%. Thomas Urano, co-chief investment officer at Sage Advisory, offered a more balanced summary: "The battle between energy and inflation concerns and safe-haven demand for U.S. Treasuries has been ongoing, but the past week has shown who has gained the upper hand. In the U.S. Treasury market, safe-haven trading is dominating." In other words, Thursday's yield decline was a result of safe-haven demand overwhelming inflationary logic within a specific time window, rather than the disappearance of inflationary logic. Uncertainty surrounding the Fed's path adds another layer of tension. Initial jobless claims released Thursday fell to 194,000, below the expected 200,000 and a three-month low, indicating that the labor market has not shown any cracks sufficient to force the Fed to immediately shift course. Market pricing in a rate hike at next week's meeting has cooled significantly, but the probability of a December rate hike remains high. Faranello's warning is worth heeding: if energy prices remain high, "it could force the Fed to take further action, which is certainly not good for the bond market." Yields below 5% are a safe haven during a safe-haven window, but in a scenario of renewed inflation acceleration, the same level could quickly become a fragile resistance level.Editor's Summary
The core message of Thursday's US Treasury market wasn't about any specific price level, but rather the observable shift in the order of driving forces. The financing structure for AI capital expenditures has shifted from being dominated by equity and cash flow to being deeply involved in the debt market, extending the risk attributes of tech stocks to credit risk; geopolitics has evolved from background noise into a priceable near-term variable. Both factors have collectively pushed safe-haven demand to a dominant position in the short term, overriding the fundamental logic of inflation and tightening. However, the sustainability of the 10-year yield remaining below 5% depends on an unanswered question: once risk aversion subsides, will the market face an environment of inflation above 3%, a resilient labor market, and unabated Treasury supply pressure, or will the contraction in AI financing itself constitute sufficient tightening of financial conditions to force central banks to reassess their path? The loss of 5% is the opening act, not the conclusion, of this contest. (Daily chart of the US 10-year Treasury yield, source: EasyTrade)Frequently Asked Questions
Q: Why is the drop in the 10-year Treasury yield below 5% given such significance? The 5% level has become a focal point due to its psychological, valuation, and policy attributes. Psychologically, it's a round number, easily triggering self-reinforcing effects from algorithmic trading and media narratives. Valuationally, when yields are above 5%, some institutional investors see it as a threshold for "sufficient returns without taking on stock risk," and this logic is weakened after it falls below 5%. Policy-wise, earlier this month, when yields rose to their highest level in over two decades, the market discussed whether they were already replacing some of the Fed's tightening function; falling below 5% temporarily alleviated concerns about "excessively tight financial conditions." However, it's important to clarify that 5% itself is not a Fed policy target, nor does it constitute a hard constraint in an economic sense; its significance comes from the reference value that market participants assign to it at a specific point in time. Q: What is the transmission relationship between Meta's spending commitments and the Treasury yield? The key link in the transmission chain is credit risk pricing. When Meta pushed its future spending commitments to $825 billion and its free cash flow turned negative, its bonds weakened relative to Treasury bonds, and CDS prices rose to record highs, indicating that investors were beginning to demand higher risk compensation for holding tech company debt. If this process spreads, the marginal cost for tech companies to finance AI infrastructure will rise, potentially dampening capital expenditure expectations and weakening economic growth prospects. Weaker growth expectations will lower the central level of real interest rates, thus putting downward pressure on Treasury yields. In other words, Thursday's rise in US Treasuries was not simply due to "money flowing from the stock market to the bond market"; the deeper mechanism is that changes in AI financing models are altering the market's assessment of medium-term growth and credit conditions. Question: The surge in oil prices should have boosted inflation expectations and negatively impacted bonds, so why didn't it prevent yields from falling on Thursday? This involves a short-term shift in market pricing weights. Under normal circumstances, rising oil prices push up yields through two channels: increasing inflation compensation and reinforcing expectations of central bank tightening. However, in Thursday's pricing, geopolitical uncertainty also directly suppressed risk assets. The sell-off in stocks and credit products outpaced the fermentation of inflationary logic, with safe-haven demand marginally dominating. This does not mean the relationship between oil prices and yields has broken down—if energy prices remain high for a longer period, the rise in inflation compensation will eventually re-enter pricing. The real risk scenario is a "stagflation combination": growth concerns trigger safe-haven buying, while supply shocks keep inflation high. In this case, the yield curve may diverge in a more complex way, rather than a simple overall downward trend. Q: The Fed is unlikely to raise rates next week, so why is the expectation of a December rate hike still there? The two are not contradictory; they reflect the Fed's balance between "waiting for data" and "maintaining credibility." Recent data is mixed: initial jobless claims falling to 194,000 shows the labor market remains resilient, but price adjustments in AI-related assets and tightening credit conditions constitute a tightening force on the financial side. The Fed's decision to hold rates steady in October allows it to maintain an observation window and policy flexibility within a "data-dependent" framework. The existence of a December rate hike, however, reflects the pricing in of inflation remaining above 3%—if inflation data in the next two months doesn't show a satisfactory decline, the central bank needs to retain the option to tighten to anchor expectations. For the bond market, the October pause has been fully priced in; the real risk lies in the race between inflation data and changes in financial conditions before the December meeting. Q: What core logic should ordinary investors understand from this round of US Treasury volatility? The core logic is the "role switching of the same asset under different narratives." In the inflation narrative, 10-year US Treasuries are a sell target; in the growth and credit concern narrative, they are a safe-haven asset; and in the valuation narrative, they become an attractive duration exposure. Thursday's market action demonstrated the speed of this role switching: from a more than two-decade high to returning below 5% in less than three weeks. For non-professional investors, the more actionable lesson lies not in predicting the next price level, but in understanding whether the definition of "safe assets" in their portfolio implicitly relies on a particular narrative. When switching between hedging and inflation trading becomes frequent, the concentration of positions in a single scenario itself becomes a source of risk. The value of diversification at this time lies not in increasing returns, but in reducing reliance on the correctness of any particular narrative. At 09:46 Beijing time, the yield on the 10-year US Treasury bond is currently at 4.963%.- Risk Warning and Disclaimer
- The market involves risk, and trading may not be suitable for all investors. This article is for reference only and does not constitute personal investment advice, nor does it take into account certain users’ specific investment objectives, financial situation, or other needs. Any investment decisions made based on this information are at your own risk.