Gold prices consolidated around $4,000, with the rebound proving fragile ahead of the Fed decision.
2026-10-27 01:26:22
Spot gold saw bargain hunting on Monday after a sharp drop last week, falling to a low of $3,975, its lowest level since July. Diplomatic efforts by Middle Eastern parties and a slight easing of regional tensions led to a decline in oil prices, providing some support for gold. However, a rebound in the US dollar limited gold's upside potential ahead of Wednesday's Federal Reserve monetary policy decision. Spot gold traded around $4,025, up 0.79% on the day. The US Dollar Index (DXY) was at 101.875; last week, the index fell to 101.45, its lowest level since October 1st.  Officials from the Mecca Agreement's three member states—Saudi Arabia, Pakistan, and Turkey—met with Iranian leaders in Tehran on Monday, according to reports. Iranian Foreign Ministry spokesman Esmail Bagheei stated that the talks would discuss Israel's expansionist policies, the situations in Palestine and Lebanon, and the consequences of US-Israeli military action against Iran. This meeting followed talks between Qatari mediators and Iranian officials in Tehran on Sunday, aimed at easing tensions in the region. West Texas Intermediate (WTI) crude oil fell from its May high of $103.28 reached on Friday, dropping to around $100.30 per barrel. Gold fell approximately 4% last week. Higher oil prices reinforced market expectations of further monetary tightening by the Federal Reserve, a negative factor that outweighed the positive impact of declining US Treasury yields and a weaker dollar. Market concerns about investment risks in the artificial intelligence sector led to an influx of funds into government bonds, putting pressure on US Treasury yields. A broad sell-off in the stock market also forced some traders to sell gold to offset losses in other markets. The Federal Reserve's monetary policy decision will determine whether gold can hold the psychological level of $4,000 or face another round of selling. The market widely expects the Fed to maintain the 3.75%-4.00% interest rate range, following a 25 basis point rate hike in September. However, if policymakers leave open the possibility of another rate hike in December, even a pause in rate hikes this time is unlikely to be beneficial for gold bulls; according to the CME FedWatch Tool, traders are currently pricing in a 79% probability of a December rate hike. The Fed is expected to keep interest rates unchanged, but persistently high inflation increases the risk of a December rate hike. Analysts at TD Securities believe that "the Federal Open Market Committee (FOMC) and Chairman Warsh are unlikely to release many new signals." The firm stated that "a pause in rate hikes in October will further increase the likelihood of a December rate hike," especially given the unexpected rise in the September Consumer Price Index (CPI), which fully demonstrates that "the risk of inflation remains significant." TD Securities predicts the Federal Reserve will raise interest rates twice more, in December and March of the following year, noting that "current inflation remains above target, and various risks continue to accumulate." The firm added that subsequent inflation data will determine the magnitude and pace of further rate hikes in this cycle; in other words, price-related data will be a core determinant of the Fed's policy direction after the beginning of next year. Technical Analysis
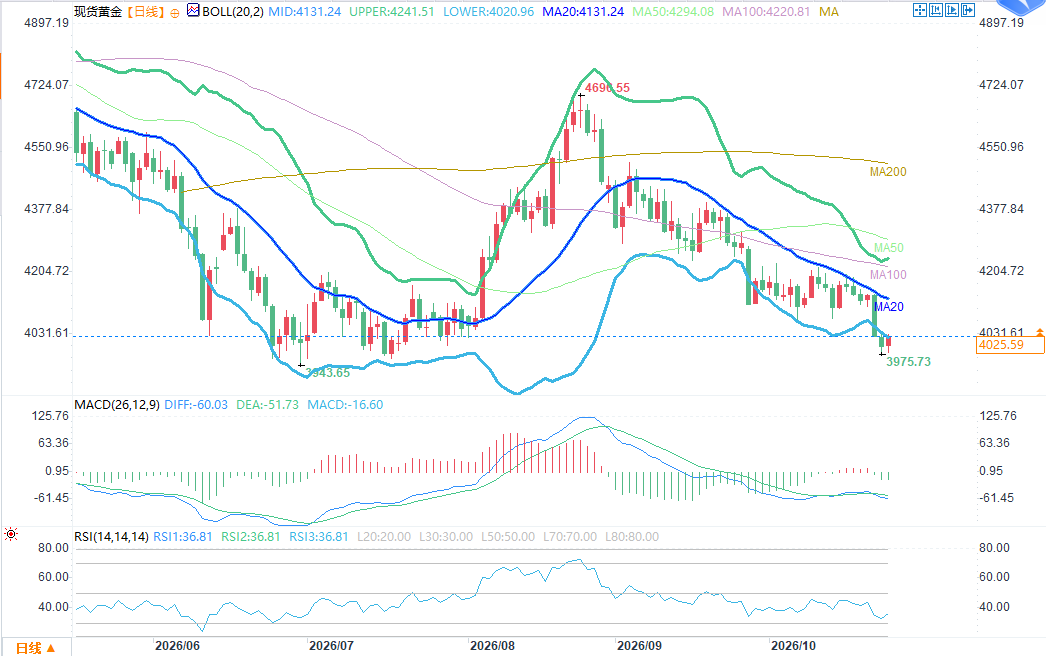 (Spot Gold Daily Chart Source: EasyTrade) On the daily chart, gold prices rebounded from near previous lows, currently trading near the lower Bollinger Band and attempting to stabilize in the short-term support zone. However, the overall price structure remains below the medium- and long-term moving averages, with the middle Bollinger Band and the upper moving average group acting as resistance. The rebound is more of a "correction after overselling" than a clear trend reversal. In terms of indicators, the MACD histogram has narrowed, showing signs of short-term momentum recovery, but a clear golden cross or trend reversal has not yet formed. The RSI has rebounded from its lows, indicating some easing of bearish pressure, but the value has not yet entered the strong zone. Therefore, the current rebound reflects more of buying interest at lower levels and is insufficient to prove that the downtrend has ended. Resistance: Near the middle Bollinger Band and the area of dense moving averages shown in the chart, approximately in the $4130–$4240 range. If gold prices fail to break through this area with significant volume, the rebound potential is limited, and there is still a risk of retesting the lows. Support: Near the recent lows, approximately $3975–$3950. If prices can hold above this area, the low-level consolidation and recovery pattern is likely to continue; conversely, a decisive break below support could open up further downside potential, targeting $3,900 or even lower. The current technical outlook remains bearish, and the rebound's foundation is not yet solid. The key factors for gold's future movement are: first, whether it can hold above the lower Bollinger Band and recover to above the middle band; and second, whether the moving average resistance zone can be effectively broken. Before breaking through key resistance levels, it is inappropriate to define the current rebound as a trend reversal.
Officials from the Mecca Agreement's three member states—Saudi Arabia, Pakistan, and Turkey—met with Iranian leaders in Tehran on Monday, according to reports. Iranian Foreign Ministry spokesman Esmail Bagheei stated that the talks would discuss Israel's expansionist policies, the situations in Palestine and Lebanon, and the consequences of US-Israeli military action against Iran. This meeting followed talks between Qatari mediators and Iranian officials in Tehran on Sunday, aimed at easing tensions in the region. West Texas Intermediate (WTI) crude oil fell from its May high of $103.28 reached on Friday, dropping to around $100.30 per barrel. Gold fell approximately 4% last week. Higher oil prices reinforced market expectations of further monetary tightening by the Federal Reserve, a negative factor that outweighed the positive impact of declining US Treasury yields and a weaker dollar. Market concerns about investment risks in the artificial intelligence sector led to an influx of funds into government bonds, putting pressure on US Treasury yields. A broad sell-off in the stock market also forced some traders to sell gold to offset losses in other markets. The Federal Reserve's monetary policy decision will determine whether gold can hold the psychological level of $4,000 or face another round of selling. The market widely expects the Fed to maintain the 3.75%-4.00% interest rate range, following a 25 basis point rate hike in September. However, if policymakers leave open the possibility of another rate hike in December, even a pause in rate hikes this time is unlikely to be beneficial for gold bulls; according to the CME FedWatch Tool, traders are currently pricing in a 79% probability of a December rate hike. The Fed is expected to keep interest rates unchanged, but persistently high inflation increases the risk of a December rate hike. Analysts at TD Securities believe that "the Federal Open Market Committee (FOMC) and Chairman Warsh are unlikely to release many new signals." The firm stated that "a pause in rate hikes in October will further increase the likelihood of a December rate hike," especially given the unexpected rise in the September Consumer Price Index (CPI), which fully demonstrates that "the risk of inflation remains significant." TD Securities predicts the Federal Reserve will raise interest rates twice more, in December and March of the following year, noting that "current inflation remains above target, and various risks continue to accumulate." The firm added that subsequent inflation data will determine the magnitude and pace of further rate hikes in this cycle; in other words, price-related data will be a core determinant of the Fed's policy direction after the beginning of next year. Technical Analysis (Spot Gold Daily Chart Source: EasyTrade) On the daily chart, gold prices rebounded from near previous lows, currently trading near the lower Bollinger Band and attempting to stabilize in the short-term support zone. However, the overall price structure remains below the medium- and long-term moving averages, with the middle Bollinger Band and the upper moving average group acting as resistance. The rebound is more of a "correction after overselling" than a clear trend reversal. In terms of indicators, the MACD histogram has narrowed, showing signs of short-term momentum recovery, but a clear golden cross or trend reversal has not yet formed. The RSI has rebounded from its lows, indicating some easing of bearish pressure, but the value has not yet entered the strong zone. Therefore, the current rebound reflects more of buying interest at lower levels and is insufficient to prove that the downtrend has ended. Resistance: Near the middle Bollinger Band and the area of dense moving averages shown in the chart, approximately in the $4130–$4240 range. If gold prices fail to break through this area with significant volume, the rebound potential is limited, and there is still a risk of retesting the lows. Support: Near the recent lows, approximately $3975–$3950. If prices can hold above this area, the low-level consolidation and recovery pattern is likely to continue; conversely, a decisive break below support could open up further downside potential, targeting $3,900 or even lower. The current technical outlook remains bearish, and the rebound's foundation is not yet solid. The key factors for gold's future movement are: first, whether it can hold above the lower Bollinger Band and recover to above the middle band; and second, whether the moving average resistance zone can be effectively broken. Before breaking through key resistance levels, it is inappropriate to define the current rebound as a trend reversal.
- Risk Warning and Disclaimer
- The market involves risk, and trading may not be suitable for all investors. This article is for reference only and does not constitute personal investment advice, nor does it take into account certain users’ specific investment objectives, financial situation, or other needs. Any investment decisions made based on this information are at your own risk.