Crude Oil Trading Alert: Geopolitical risk premiums and declining inventories provide dual support, pushing US crude oil back to the upper edge of its trading range.
2026-10-29 09:36:27
WTI crude oil traded around $101.20 in early Asian trading on Thursday, continuing its strong performance this week. The core driver of this rally is substantial supply-side disruption, rather than a mere emotional impulse. Following their attack on the Rastanura refinery, the Houthi rebels launched an attack on Aden airport with prior warnings of evacuation; this "preemptive strike" demonstrates their ability and intention to continuously disrupt key facilities. Meanwhile, Iranian tanker attacks have already impacted traffic in the Strait of Hormuz. Dennis Kissler, Senior Vice President of Trading at BOK Financial, highlights the key to the current pricing structure: "Crude oil futures are again pricing in recent supply tightening due to news of a possible resumption of US military action, which could be more intense than previous attacks against Saudi Arabia and other Middle Eastern allies." This means the market is pricing in a "low-probability but highly impactful" tail scenario, rather than a supply disruption that has already occurred—which is why the risk premium is difficult to dissipate quickly.  From the perspective of supporting factors, the core contradiction lies in the interplay between the "normalization of geopolitical premiums" and the "bearing capacity of demand." On the one hand, the larger-than-expected decline in EIA inventories (down 1.462 million barrels, compared to a previous decline of 3.061 million barrels) provides concrete evidence from the fundamentals, indicating that current prices have not suppressed actual restocking demand. On the other hand, TD Securities points out an often-overlooked constraint: freight rates have become an increasingly important marginal driver. "Besides the escalation of conflicts in the Middle East, freight rates are increasingly becoming an important marginal driver. High refinery landed costs may limit the upside potential of oil prices, as weakening profits will limit refinery utilization rates." This statement reveals the inherent ceiling of this round of price increases—when costs are transmitted to refineries through freight and landed prices, demand disruption will first be reflected in utilization rates, rather than in end-consumer data. Therefore, the closer oil prices are to the upper Bollinger Band, the easier it is to trigger this self-restraining mechanism. However, the upward trend structure has not yet been broken. The 100-day moving average remains significantly below the current price, while the 20-day moving average and the Bollinger Middle Band form a stepped support zone below, indicating that this round of gains is more event-driven than driven by capital inflows. This divergence is noteworthy when compared to other assets: the same developments in the Middle East provide safe-haven support for the US dollar, boost gold due to eased inflation concerns, and exert downward pressure on the Japanese yen—while for crude oil, it's purely an upward driver. This explains why, in this round of cross-asset volatility, crude oil's direction is the clearest, but its slope is constrained by both freight rates and refinery profits. From a timing perspective, the direction of Israel's government formation and the policy window following the US midterm elections constitute the main variables for the next two weeks. The former determines whether the conflict escalates from a "proxy level" to direct confrontation, while the latter determines whether the US is willing to bear the domestic political costs of a rebound in oil prices. These two variables share the characteristics of "low predictability and large impact," therefore, before the events unfold, oil prices are more likely to repeatedly test resistance at high levels rather than experience a smooth, one-sided trend. Investors should not view a single day's rise in isolation, but rather evaluate it within the transmission chain of "geopolitics—inventory—freight—refinery profits—political window": the current pricing range will only be broken when there is a substantial contraction in the Hormuz flow or when the United States explicitly abandons the military option. On the daily chart, WTI is trading around $101.20, with an overall bullish bias. The price is running above the 20-day Bollinger Band and the 100-day moving average, and has entered the upper half of the Bollinger Band channel, indicating strong near-term buying interest. The RSI (14) is at 63, with momentum biased towards the bulls and not yet in the overbought zone, which is a typical "bullish trend, poised for a breakout" pattern. The first resistance level to watch is the upper Bollinger Band at around $104.00 (where recent impulsive moves may encounter profit-taking), followed by the psychological levels of $105.00 and $107.00. Support levels to watch are the psychological level of $100.00 (a breach of this level would mitigate the bullish bias), the Bollinger Middle Band at approximately $95.10, and the more strategically important lower Bollinger Band at approximately $86.15 and the 100-day moving average at approximately $85.15. On the 4-hour chart, oil prices are moving along short-term moving averages, the MACD histogram is close to above the zero line, and the fast and slow lines are approaching a golden cross, indicating bullish momentum but a breakout has not yet been confirmed. Currently, the price is consolidating between $100.80 and $101.60. If it retraces to $100.00-$100.50 and finds support, there is still a chance for a short-term upward move towards $102.50-$104.00. However, if it breaks below $100.00 with significant volume, it may seek support at $95.10 or even $90.00.
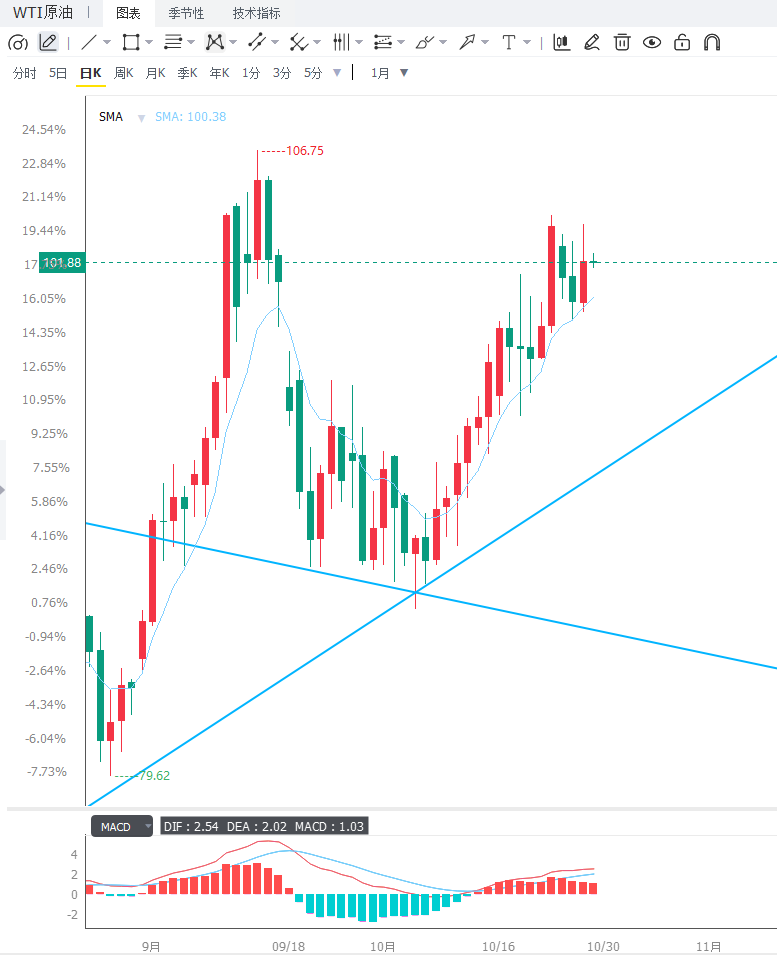 The editor summarizes that the core contradiction for WTI crude oil in the short term lies in the support provided by geopolitical risk premiums and an unexpected decline in inventories, while high freight rates suppress refinery profits and uncertainty surrounding the US policy window after the midterm elections exert restraint. These two factors suggest that oil prices are more likely to consolidate within the $100.00-$104.00 range, awaiting a breakthrough in geopolitical and inventory data. Three key variables need to be monitored: first, the Houthi actions regarding Rastanura and Aden, and the passage through the Strait of Hormuz, which are the primary indicators of whether supply disruptions have shifted from expectation to reality; second, EIA inventory data and changes in refinery utilization rates, the strength of which will verify the demand side's ability to withstand current prices; and third, whether oil prices can hold the psychological level of $100.00, which is the primary technical indicator of whether bullish momentum will continue. In addition, the Brent crude oil price movement and the WTI-Brent price spread, the US dollar index and US Treasury yields, the Middle East situation and the policy window after the midterm elections, as well as OPEC+ policy signals also need to be monitored simultaneously.
From the perspective of supporting factors, the core contradiction lies in the interplay between the "normalization of geopolitical premiums" and the "bearing capacity of demand." On the one hand, the larger-than-expected decline in EIA inventories (down 1.462 million barrels, compared to a previous decline of 3.061 million barrels) provides concrete evidence from the fundamentals, indicating that current prices have not suppressed actual restocking demand. On the other hand, TD Securities points out an often-overlooked constraint: freight rates have become an increasingly important marginal driver. "Besides the escalation of conflicts in the Middle East, freight rates are increasingly becoming an important marginal driver. High refinery landed costs may limit the upside potential of oil prices, as weakening profits will limit refinery utilization rates." This statement reveals the inherent ceiling of this round of price increases—when costs are transmitted to refineries through freight and landed prices, demand disruption will first be reflected in utilization rates, rather than in end-consumer data. Therefore, the closer oil prices are to the upper Bollinger Band, the easier it is to trigger this self-restraining mechanism. However, the upward trend structure has not yet been broken. The 100-day moving average remains significantly below the current price, while the 20-day moving average and the Bollinger Middle Band form a stepped support zone below, indicating that this round of gains is more event-driven than driven by capital inflows. This divergence is noteworthy when compared to other assets: the same developments in the Middle East provide safe-haven support for the US dollar, boost gold due to eased inflation concerns, and exert downward pressure on the Japanese yen—while for crude oil, it's purely an upward driver. This explains why, in this round of cross-asset volatility, crude oil's direction is the clearest, but its slope is constrained by both freight rates and refinery profits. From a timing perspective, the direction of Israel's government formation and the policy window following the US midterm elections constitute the main variables for the next two weeks. The former determines whether the conflict escalates from a "proxy level" to direct confrontation, while the latter determines whether the US is willing to bear the domestic political costs of a rebound in oil prices. These two variables share the characteristics of "low predictability and large impact," therefore, before the events unfold, oil prices are more likely to repeatedly test resistance at high levels rather than experience a smooth, one-sided trend. Investors should not view a single day's rise in isolation, but rather evaluate it within the transmission chain of "geopolitics—inventory—freight—refinery profits—political window": the current pricing range will only be broken when there is a substantial contraction in the Hormuz flow or when the United States explicitly abandons the military option. On the daily chart, WTI is trading around $101.20, with an overall bullish bias. The price is running above the 20-day Bollinger Band and the 100-day moving average, and has entered the upper half of the Bollinger Band channel, indicating strong near-term buying interest. The RSI (14) is at 63, with momentum biased towards the bulls and not yet in the overbought zone, which is a typical "bullish trend, poised for a breakout" pattern. The first resistance level to watch is the upper Bollinger Band at around $104.00 (where recent impulsive moves may encounter profit-taking), followed by the psychological levels of $105.00 and $107.00. Support levels to watch are the psychological level of $100.00 (a breach of this level would mitigate the bullish bias), the Bollinger Middle Band at approximately $95.10, and the more strategically important lower Bollinger Band at approximately $86.15 and the 100-day moving average at approximately $85.15. On the 4-hour chart, oil prices are moving along short-term moving averages, the MACD histogram is close to above the zero line, and the fast and slow lines are approaching a golden cross, indicating bullish momentum but a breakout has not yet been confirmed. Currently, the price is consolidating between $100.80 and $101.60. If it retraces to $100.00-$100.50 and finds support, there is still a chance for a short-term upward move towards $102.50-$104.00. However, if it breaks below $100.00 with significant volume, it may seek support at $95.10 or even $90.00. The editor summarizes that the core contradiction for WTI crude oil in the short term lies in the support provided by geopolitical risk premiums and an unexpected decline in inventories, while high freight rates suppress refinery profits and uncertainty surrounding the US policy window after the midterm elections exert restraint. These two factors suggest that oil prices are more likely to consolidate within the $100.00-$104.00 range, awaiting a breakthrough in geopolitical and inventory data. Three key variables need to be monitored: first, the Houthi actions regarding Rastanura and Aden, and the passage through the Strait of Hormuz, which are the primary indicators of whether supply disruptions have shifted from expectation to reality; second, EIA inventory data and changes in refinery utilization rates, the strength of which will verify the demand side's ability to withstand current prices; and third, whether oil prices can hold the psychological level of $100.00, which is the primary technical indicator of whether bullish momentum will continue. In addition, the Brent crude oil price movement and the WTI-Brent price spread, the US dollar index and US Treasury yields, the Middle East situation and the policy window after the midterm elections, as well as OPEC+ policy signals also need to be monitored simultaneously.
- Risk Warning and Disclaimer
- The market involves risk, and trading may not be suitable for all investors. This article is for reference only and does not constitute personal investment advice, nor does it take into account certain users’ specific investment objectives, financial situation, or other needs. Any investment decisions made based on this information are at your own risk.