













Silver Price Forecast: Silver rebounds above $50, oil prices plummet, but the bearish trend remains intact.
2026-11-03 00:08:25
On Monday (November 2), spot silver attempted a rebound after falling to a new low for the year at $48.47 on Friday. This recovery coincided with positive diplomatic signals from both the US and Iran, causing oil prices to plummet by more than 5%. Silver traded at $51.037 during the session, up 3.93% on the day.  According to the Iranian Students' News Agency (ISNA), Iranian President Masoud Pezechzian stated that the Supreme Leader has authorized the government to exercise certain powers in negotiations. Previously, Axios reported that US President Trump preferred to allow more time for diplomacy with Iran. Falling oil prices eased inflation concerns, causing US Treasury yields to extend their recent decline following a tech stock sell-off and further pressuring the US dollar (USD). These factors collectively supported the rebound in silver prices. However, further sharp declines in oil prices are far from certain, as diplomatic progress remains uncertain, and both Washington and Tehran retain military options. Therefore, the upside potential for silver depends on whether diplomacy can lead to a sustained decline in oil prices. Otherwise, high energy costs could keep inflation risks in focus and allow the Federal Reserve (Fed) to maintain a hawkish stance. Higher interest rates increase the opportunity cost of holding silver, which itself does not generate returns. Technical Analysis
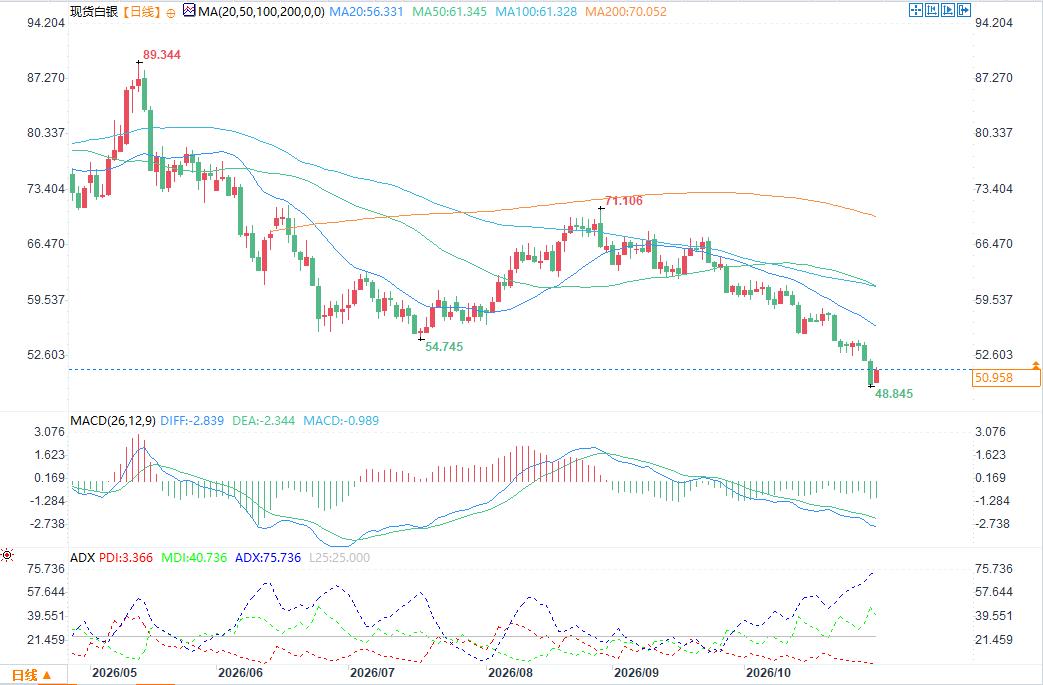 From the daily chart, silver is trading below the 20-day moving average ($56.3), 50-day moving average ($61.3), 100-day moving average ($61.3), and 200-day moving average ($70.1), maintaining a bearish outlook. This arrangement of prices below all major trend filters suggests that the precious metal is in a broader correction phase; meanwhile, the latest price of $50.97 has broken below the $52.6 level reference point on the chart, indicating a continued downward shift in the short-term center of gravity. The Moving Average Convergence Divergence (MACD) remains in negative territory, with the DIFF (-2.84) below the DEA (-2.34) and the green histogram (-0.99) continuing its downward trend. Meanwhile, the upward-trending Directional Index (ADX) reaches 75.7, and the MDI (40.7) is significantly higher than the PDI (3.4), indicating that despite the significant short-term decline, the current downward trend remains strong. On the upside, initial resistance is around $52.6, with stronger resistance at the 20-day moving average of $56.3, further reinforcing this supply range. The 50-day and 100-day moving averages converge near $61.3, marking a deeper recovery resistance level, followed by the previous sideways consolidation top of $66-$67 and the longer-term 200-day moving average at $70.1. On the downside, immediate support is near the latest low of $48.85; a break below this level would expose the possibility of further downside. However, the chart lacks direct readings from oversold oscillators, and the high ADX indicates continued strong trend strength. Therefore, whether short covering will occur when the price slides towards this low zone requires confirmation from the narrowing of the MACD histogram and price stabilization signals, rather than simply predicting a new round of aggressive selling based on the magnitude of the decline.
According to the Iranian Students' News Agency (ISNA), Iranian President Masoud Pezechzian stated that the Supreme Leader has authorized the government to exercise certain powers in negotiations. Previously, Axios reported that US President Trump preferred to allow more time for diplomacy with Iran. Falling oil prices eased inflation concerns, causing US Treasury yields to extend their recent decline following a tech stock sell-off and further pressuring the US dollar (USD). These factors collectively supported the rebound in silver prices. However, further sharp declines in oil prices are far from certain, as diplomatic progress remains uncertain, and both Washington and Tehran retain military options. Therefore, the upside potential for silver depends on whether diplomacy can lead to a sustained decline in oil prices. Otherwise, high energy costs could keep inflation risks in focus and allow the Federal Reserve (Fed) to maintain a hawkish stance. Higher interest rates increase the opportunity cost of holding silver, which itself does not generate returns. Technical Analysis From the daily chart, silver is trading below the 20-day moving average ($56.3), 50-day moving average ($61.3), 100-day moving average ($61.3), and 200-day moving average ($70.1), maintaining a bearish outlook. This arrangement of prices below all major trend filters suggests that the precious metal is in a broader correction phase; meanwhile, the latest price of $50.97 has broken below the $52.6 level reference point on the chart, indicating a continued downward shift in the short-term center of gravity. The Moving Average Convergence Divergence (MACD) remains in negative territory, with the DIFF (-2.84) below the DEA (-2.34) and the green histogram (-0.99) continuing its downward trend. Meanwhile, the upward-trending Directional Index (ADX) reaches 75.7, and the MDI (40.7) is significantly higher than the PDI (3.4), indicating that despite the significant short-term decline, the current downward trend remains strong. On the upside, initial resistance is around $52.6, with stronger resistance at the 20-day moving average of $56.3, further reinforcing this supply range. The 50-day and 100-day moving averages converge near $61.3, marking a deeper recovery resistance level, followed by the previous sideways consolidation top of $66-$67 and the longer-term 200-day moving average at $70.1. On the downside, immediate support is near the latest low of $48.85; a break below this level would expose the possibility of further downside. However, the chart lacks direct readings from oversold oscillators, and the high ADX indicates continued strong trend strength. Therefore, whether short covering will occur when the price slides towards this low zone requires confirmation from the narrowing of the MACD histogram and price stabilization signals, rather than simply predicting a new round of aggressive selling based on the magnitude of the decline.
- Risk Warning and Disclaimer
- The market involves risk, and trading may not be suitable for all investors. This article is for reference only and does not constitute personal investment advice, nor does it take into account certain users’ specific investment objectives, financial situation, or other needs. Any investment decisions made based on this information are at your own risk.