













Friday's non-farm payroll report may trigger a significant market repricing.
2026-11-05 01:56:25
The market expects the Federal Reserve to raise interest rates once in December and again in 2027. However, a strong jobs report could overturn this expectation. The futures market is currently pricing in a near 80% probability of a rate hike at the Fed's next policy meeting; at this juncture, the release of the October jobs report is crucial.  This report will significantly influence market expectations regarding the Federal Reserve's policy path, an impact that will likely last until at least the first week of December when the November jobs data is released. Strong jobs data would give the Fed more leeway to focus entirely on its inflation target; it would also mean the market needs to reassess its current pricing of two more rate hikes. The market had initially expected Friday's October jobs data to be weak. However, monthly job growth has been declining over the past year. One thing is clear: the economic slowdown that emerged in the fall of 2025 is long gone, and job growth is back on track, albeit at a more moderate pace. Market Expectations: Moderate Analysts predict that nonfarm payrolls will increase by 65,000 in October, up from 29,000 in September; the unemployment rate will remain unchanged at 4.2%. Wages are expected to rise 0.3% month-over-month (previous 0.1%) and 2.9% year-over-year (previous 3.0%). Average weekly hours are expected to remain unchanged at 34.4. For some time, analysts have been predicting a slowdown in job growth: starting in October 2025, the market expects an average monthly increase of about 64,000 non-farm payroll jobs; while from January 2023 to July 2025, the average monthly increase is expected to be as high as 171,000. The trend of job growth had already clearly declined by the spring of that year.
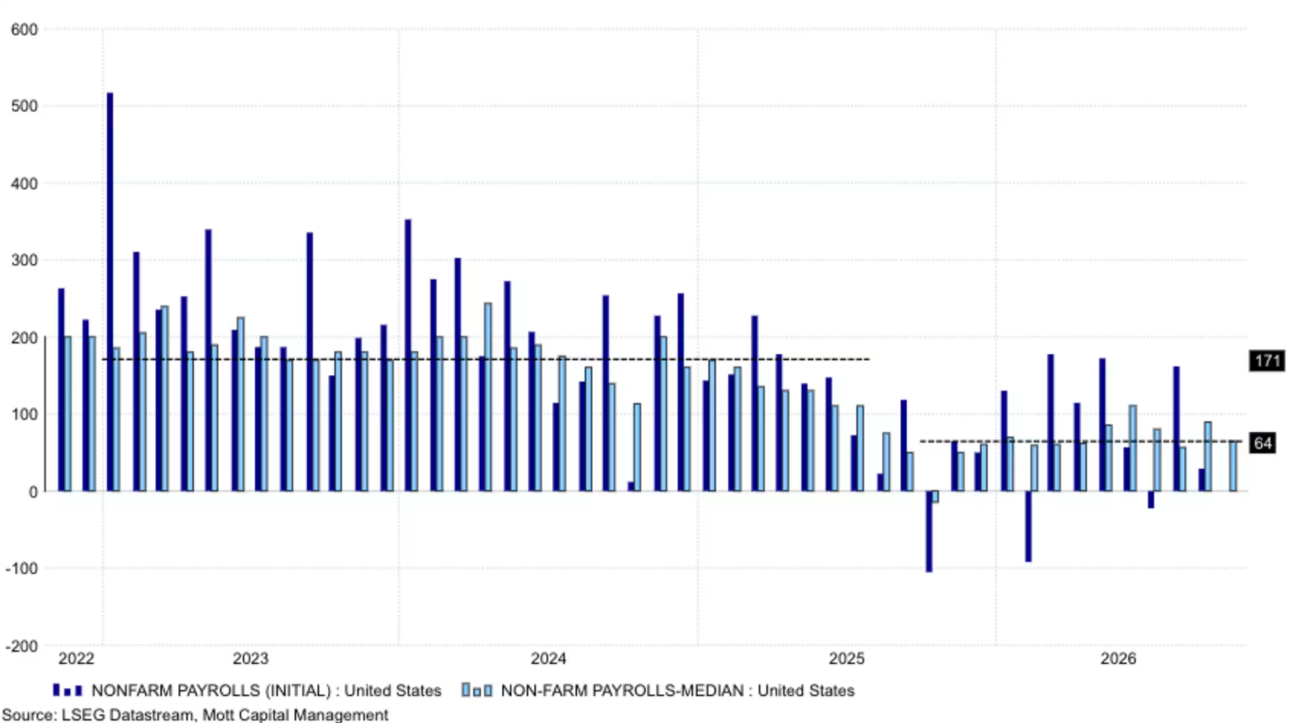 Chart Explanation: Comparing the preliminary US non-farm payroll figures (dark blue) with the median market expectation (light blue) from the end of 2021 to 2026. It can be seen that the preliminary employment figures fluctuate downwards, but the median market expectation remains relatively stable. However, data fluctuations have not significantly improved the accuracy of analysts' forecasts. Since January 2025, employment data has exceeded expectations 11 times and fallen short of expectations 10 times. When the data exceeded expectations, it averaged 63,000 more jobs than expected; when it fell short of expectations, it averaged a shortfall of 59,000 jobs.
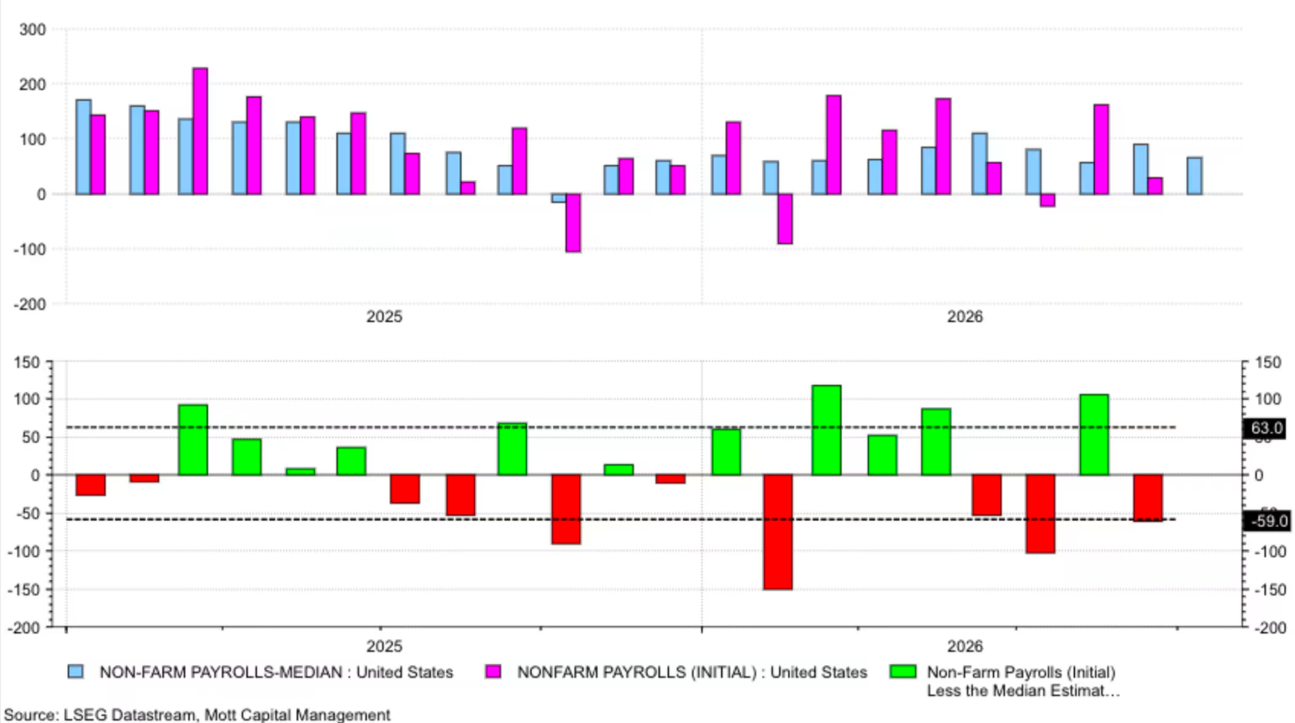 Chart Explanation: Comparison of Actual and Expected US Non-Farm Payrolls in 2025–2026. Top Chart: Median Expected Non-Farm Payrolls (blue bars) vs. Preliminary Non-Farm Payrolls (magenta bars); Bottom Chart: Difference between Actual and Expected Values, green for positive and red for negative, fluctuating roughly between -150 and +120 (thousands). Signal: The Labor Market Remains Robust A more crucial indicator of labor market health—the Weekly Total Private Sector Wages Index—has stabilized since bottoming out in December 2025, showing a steady growth trend. The subsequent recovery of this index indicates that the cooling of the labor market and the slowdown in wage growth have stabilized. Therefore, although overall job growth and wage growth have declined, the current growth rate is roughly equivalent to the pre-COVID-19 labor market level, annualized in the 4%–5% range. The contradiction lies in persistently high inflation, which continues to erode real wages, hence the Federal Reserve's need to closely monitor its inflation target.
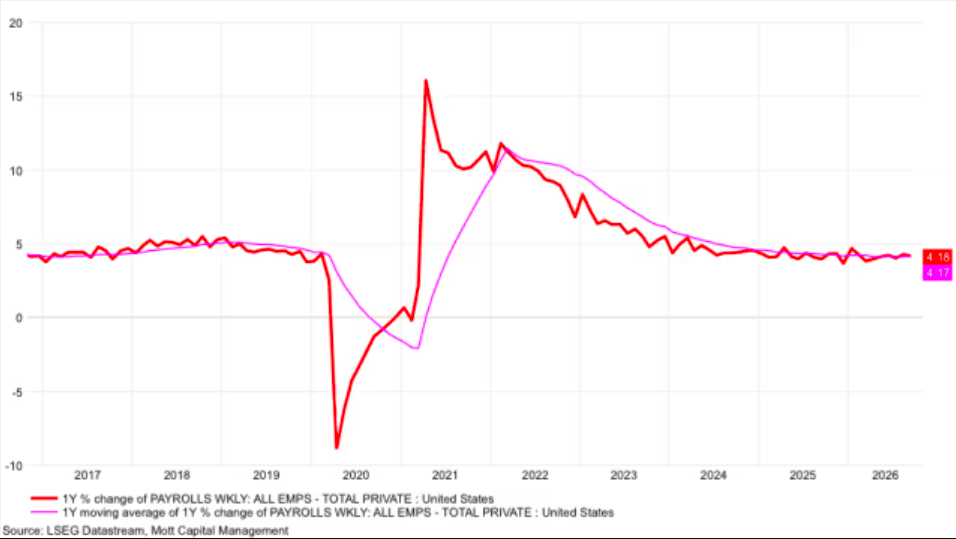 Chart Explanation: Year-on-year growth rate of total weekly earnings in the US private sector (red line) and its 12-month moving average (magenta line), 2017–2026. This means that unless the employment report shows a jump in the unemployment rate and an unexpected sharp drop in non-farm payrolls, the market's pricing of the Fed's policy path is unlikely to change significantly. The scenario that could truly reverse expectations of rate hikes is significantly stronger-than-expected employment data and a substantial decline in the unemployment rate. This would increase the probability of a December rate hike, and more importantly, the market would bring forward the timing of the rate hike, even increasing the total number of rate hikes. How many more rate hikes are needed? Current market pricing: one rate hike in December, another in 2027, with the rate hike cycle ending in 2027. Although the November employment report will be released before the Fed's rate meeting in early December, if the October data is strong, it will support further tightening of monetary policy; if the November employment report also exceeds expectations, it will send a warning signal—the number of rate hikes may not be just two. This raises a core question: Is the market's bet on "only two more rate hikes" reasonable? Has the market fully priced in subsequent rate hikes by the Federal Reserve? The underlying logic of the market's pricing in two rate hikes, coupled with the September hike, is that the Fed is simply reversing its rate cut planned for the end of 2025. However, this assumption is likely untenable: before the Fed's rate cut, inflation was already struggling to fall back to the 2% target. The core PCE price index bottomed out at 2.3% in March 2025 and then immediately rebounded, with the recovery occurring before the Fed's rate cut.
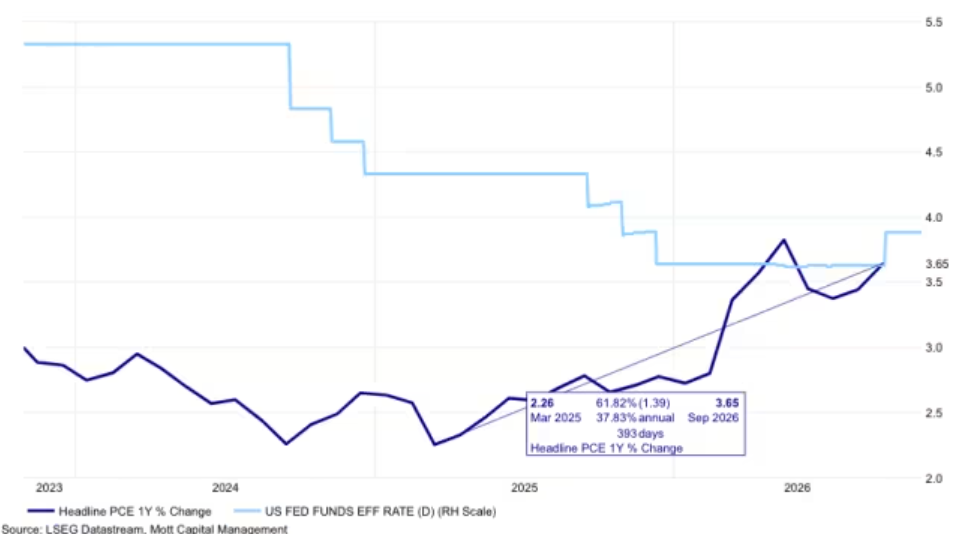 Chart Explanation: Comparison of the year-on-year growth rate of the PCE price index (purple line) and the effective federal funds rate (light blue line) from 2023 to 2026. A question worth considering: When the effective federal funds rate was 4.3%, PCE inflation failed to return to 2%; so why assume that simply pulling the interest rate back to 4.3% this time will be enough to suppress inflation?
This report will significantly influence market expectations regarding the Federal Reserve's policy path, an impact that will likely last until at least the first week of December when the November jobs data is released. Strong jobs data would give the Fed more leeway to focus entirely on its inflation target; it would also mean the market needs to reassess its current pricing of two more rate hikes. The market had initially expected Friday's October jobs data to be weak. However, monthly job growth has been declining over the past year. One thing is clear: the economic slowdown that emerged in the fall of 2025 is long gone, and job growth is back on track, albeit at a more moderate pace. Market Expectations: Moderate Analysts predict that nonfarm payrolls will increase by 65,000 in October, up from 29,000 in September; the unemployment rate will remain unchanged at 4.2%. Wages are expected to rise 0.3% month-over-month (previous 0.1%) and 2.9% year-over-year (previous 3.0%). Average weekly hours are expected to remain unchanged at 34.4. For some time, analysts have been predicting a slowdown in job growth: starting in October 2025, the market expects an average monthly increase of about 64,000 non-farm payroll jobs; while from January 2023 to July 2025, the average monthly increase is expected to be as high as 171,000. The trend of job growth had already clearly declined by the spring of that year. Chart Explanation: Comparing the preliminary US non-farm payroll figures (dark blue) with the median market expectation (light blue) from the end of 2021 to 2026. It can be seen that the preliminary employment figures fluctuate downwards, but the median market expectation remains relatively stable. However, data fluctuations have not significantly improved the accuracy of analysts' forecasts. Since January 2025, employment data has exceeded expectations 11 times and fallen short of expectations 10 times. When the data exceeded expectations, it averaged 63,000 more jobs than expected; when it fell short of expectations, it averaged a shortfall of 59,000 jobs. Chart Explanation: Comparison of Actual and Expected US Non-Farm Payrolls in 2025–2026. Top Chart: Median Expected Non-Farm Payrolls (blue bars) vs. Preliminary Non-Farm Payrolls (magenta bars); Bottom Chart: Difference between Actual and Expected Values, green for positive and red for negative, fluctuating roughly between -150 and +120 (thousands). Signal: The Labor Market Remains Robust A more crucial indicator of labor market health—the Weekly Total Private Sector Wages Index—has stabilized since bottoming out in December 2025, showing a steady growth trend. The subsequent recovery of this index indicates that the cooling of the labor market and the slowdown in wage growth have stabilized. Therefore, although overall job growth and wage growth have declined, the current growth rate is roughly equivalent to the pre-COVID-19 labor market level, annualized in the 4%–5% range. The contradiction lies in persistently high inflation, which continues to erode real wages, hence the Federal Reserve's need to closely monitor its inflation target. Chart Explanation: Year-on-year growth rate of total weekly earnings in the US private sector (red line) and its 12-month moving average (magenta line), 2017–2026. This means that unless the employment report shows a jump in the unemployment rate and an unexpected sharp drop in non-farm payrolls, the market's pricing of the Fed's policy path is unlikely to change significantly. The scenario that could truly reverse expectations of rate hikes is significantly stronger-than-expected employment data and a substantial decline in the unemployment rate. This would increase the probability of a December rate hike, and more importantly, the market would bring forward the timing of the rate hike, even increasing the total number of rate hikes. How many more rate hikes are needed? Current market pricing: one rate hike in December, another in 2027, with the rate hike cycle ending in 2027. Although the November employment report will be released before the Fed's rate meeting in early December, if the October data is strong, it will support further tightening of monetary policy; if the November employment report also exceeds expectations, it will send a warning signal—the number of rate hikes may not be just two. This raises a core question: Is the market's bet on "only two more rate hikes" reasonable? Has the market fully priced in subsequent rate hikes by the Federal Reserve? The underlying logic of the market's pricing in two rate hikes, coupled with the September hike, is that the Fed is simply reversing its rate cut planned for the end of 2025. However, this assumption is likely untenable: before the Fed's rate cut, inflation was already struggling to fall back to the 2% target. The core PCE price index bottomed out at 2.3% in March 2025 and then immediately rebounded, with the recovery occurring before the Fed's rate cut. Chart Explanation: Comparison of the year-on-year growth rate of the PCE price index (purple line) and the effective federal funds rate (light blue line) from 2023 to 2026. A question worth considering: When the effective federal funds rate was 4.3%, PCE inflation failed to return to 2%; so why assume that simply pulling the interest rate back to 4.3% this time will be enough to suppress inflation?
- Risk Warning and Disclaimer
- The market involves risk, and trading may not be suitable for all investors. This article is for reference only and does not constitute personal investment advice, nor does it take into account certain users’ specific investment objectives, financial situation, or other needs. Any investment decisions made based on this information are at your own risk.