













How solid is the crude oil rebalancing after the International Energy Agency raised supply estimates?
2026-11-13 18:00:28
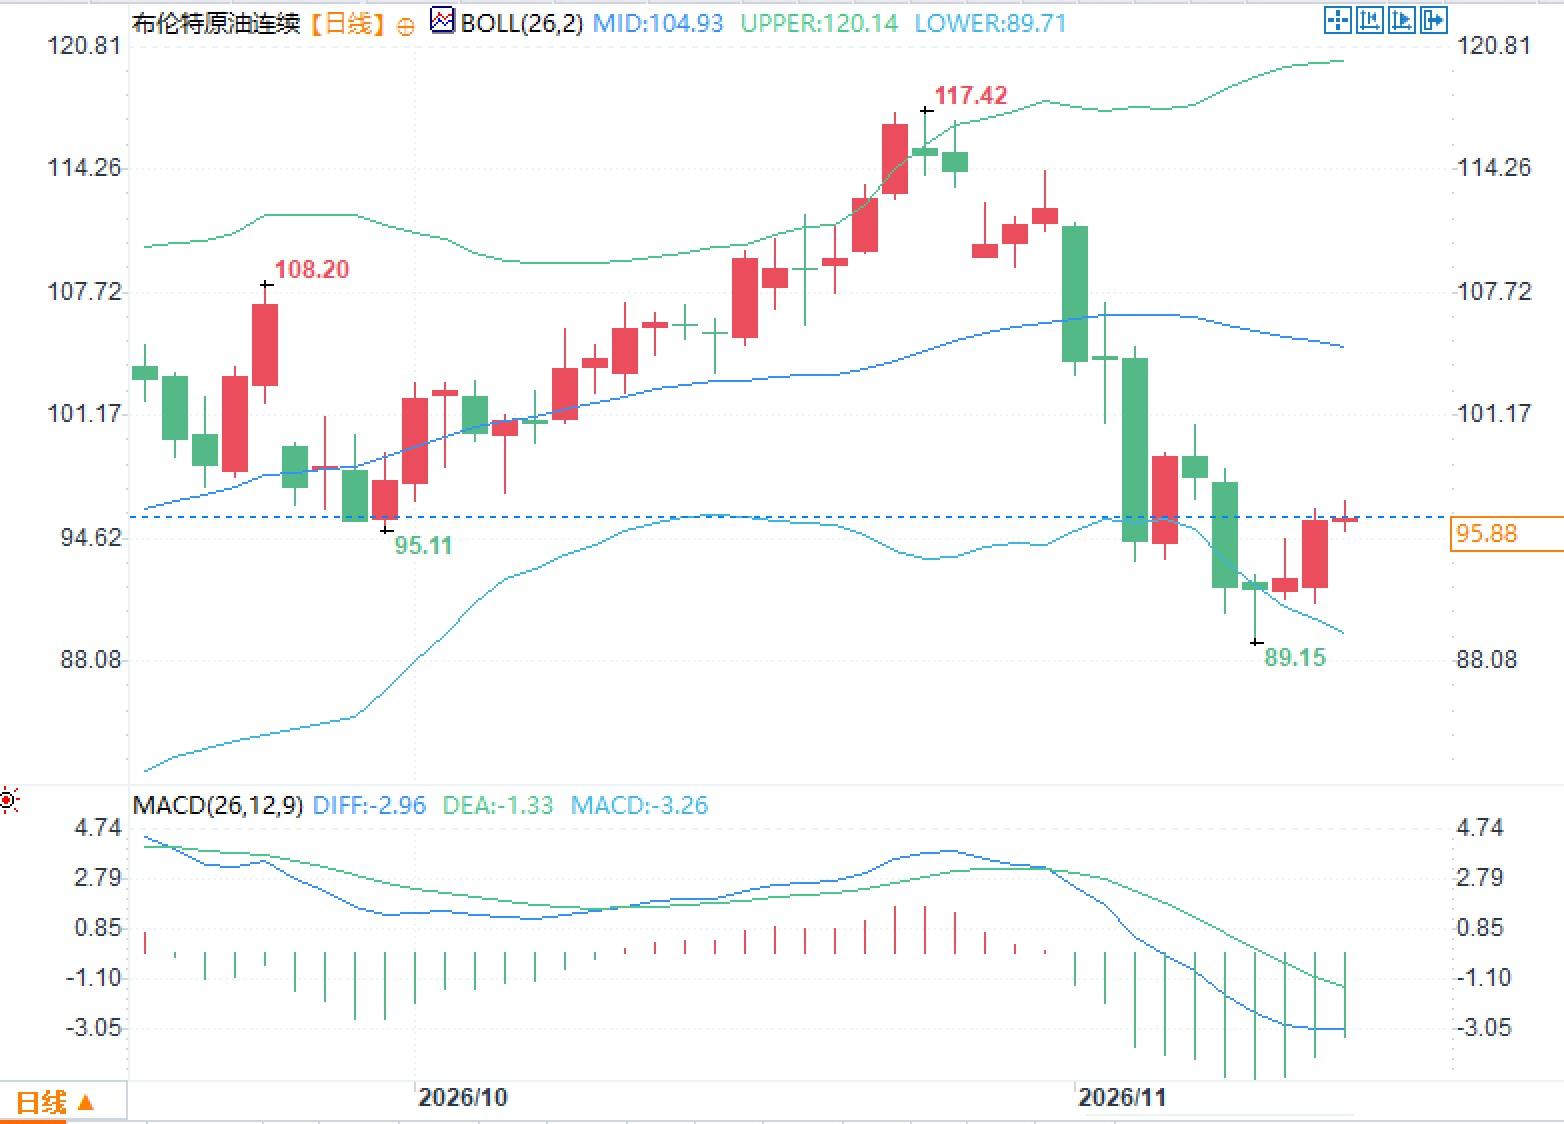
On Friday, November 13, Brent crude oil prices fluctuated around $95.80 per barrel, having fallen by about 18% this month. The International Energy Agency's latest monthly report indicated that the global oil market is showing initial signs of a supply-demand rebalancing for the first time since the outbreak of the conflict with Iran. Exports from the Gulf region have recovered faster than demand has weakened, leading to a supply surplus of approximately 2 million barrels per day this quarter, while the full-year deficit forecast for 2026 has been significantly revised downward from 1.7 million barrels per day to 685,000 barrels per day. The price decline has eased pressure on consumers and central banks regarding fuel costs, but onshore inventories remain at near-decade lows, and the tightness in the product market, particularly in the diesel sector, has not yet fully subsided. 
Supply recovery drives market rebalancing
The International Energy Agency (IEA) raised its 2026 global oil supply forecast by 920,000 barrels per day (bpd), primarily due to a rebound in Middle Eastern exports. Global supply rose to 105.4 million bpd in October, an increase of 2.3 million bpd from September, with Gulf exports (excluding Oman) reaching 18.4 million bpd, approximately 74% of pre-conflict levels. Saudi Arabian production rebounded to approximately 10 million bpd in October, while Iraqi production hit a seven-year high of 4.6 million bpd. This recovery was significantly faster than demand, shifting the supply-demand deficit for the quarter from approximately 2 million bpd as projected last month to a similar-sized surplus. A small deficit is still expected for the full year, but the margin has narrowed by 60% compared to the previous month's report. The ongoing attacks on tankers due to the conflict have not completely halted the recovery process, with supply-side resilience becoming the core driver of rebalancing.Export rebound and inventory structure divergence
Observable inventories rose by 52 million barrels in October, the first increase since June, but almost all of the increase came from floating storage at sea, while onshore inventories fell to their lowest level in nearly a decade. Cumulative inventory reduction since the outbreak of the conflict has reached 462 million barrels. The export rebound mainly relied on ship-to-ship transshipment and other methods to bypass transportation bottlenecks, leading to a rapid recovery in regional loadings, but infrastructure and tanker risks remain. This divergence in inventory structure means that the apparent supply easing is more reflected in transit than in a substantial replenishment of available end-user inventory. Refinery utilization fell to a seasonal low of 81.3 million barrels per day in October and is expected to rebound in December, but will still decline year-on-year for the whole year. The mismatch between supply recovery and inventory levels constitutes a key variable in the current market balance.Declining demand and marginal improvement in the product market
Global oil demand is projected to decline by 2.68 million barrels per day in 2026, to an average of 102.3 million barrels per day, a slightly larger drop than the previous month's forecast. High prices, electrification, and improved fuel efficiency have dampened a rebound in vehicle fuel demand, with growth primarily concentrated in the petrochemical feedstock sector. The outlook for the diesel and fuel oil markets is showing "marginal improvement," with high prices already suppressing consumption, although European diesel prices remain approximately 77% higher than pre-conflict levels. International Energy Agency member countries will accelerate the release of previously pledged emergency stocks, releasing an additional 71 million barrels until the end of February. The combined effect of structural weakness on the demand side and a phased recovery on the supply side has significantly narrowed the full-year deficit, but the tightness in product supply, especially middle distillates, still warrants attention regarding subsequent exports and the pace of refinery recovery.Technical Indicators and Emergency Inventory Release Observation
On the daily chart, the Bollinger Band middle line is at 104.93, the upper line is at 120.14, and the lower line is at 89.71, with the current price in the lower half of the band. The MACD shows a DIFF of -2.96, a DEA of -1.33, and a histogram of -3.26, indicating negative momentum. Recent highs occurred around 117.42, and lows touched 89.15. This month's price decline corresponds to rising expectations of supply recovery, but technical indicators only reflect existing price fluctuations and moving average relationships. Accelerated release of emergency inventories helps alleviate short-term product shortages, but low onshore inventories and transportation risks still pose potential constraints. Market participants are focused on whether Gulf exports can be sustained, whether inventory reduction has ended, and whether the demand recovery is limited to the petrochemical sector.Frequently Asked Questions
Question 1: Why did the International Energy Agency (IEA) assess a supply surplus this quarter? Answer: Gulf exports recovered to approximately 74% of pre-conflict levels, and October supply increased to 105.4 million barrels per day, outpacing the decline in demand. This pushed the quarter from a deficit to a surplus of approximately 2 million barrels per day, significantly narrowing the full-year deficit for 2026. Question 2: Why is the inventory rebound still considered structurally differentiated? Answer: The 52 million barrels increase in October mainly came from floating storage at sea, while onshore inventories remain at near-decade lows, with a cumulative reduction of 462 million barrels, indicating that available end-user inventories have not been replenished in tandem. Question 3: What does the decline in demand mean for the product market? Answer: High prices are suppressing vehicle fuel consumption, with demand growth concentrated in petrochemical feedstocks. The diesel market is only showing marginal improvement. The further release of 71 million barrels from emergency inventories helps buffer this, but the pace of refinery and export operations remains crucial.- Risk Warning and Disclaimer
- The market involves risk, and trading may not be suitable for all investors. This article is for reference only and does not constitute personal investment advice, nor does it take into account certain users’ specific investment objectives, financial situation, or other needs. Any investment decisions made based on this information are at your own risk.