The hidden concerns behind the bull carnival: Will the overbought signal of gold trigger a deep adjustment?
2025-09-12 17:36:33
On Friday (September 12), spot gold prices continued their upward trend, reaching an intraday high of $3,656 per ounce before slightly retracing to around $3,641.18 during the European session. This rally, which began in mid-August, has seen a cumulative gain of over $200, demonstrating strong bullish momentum.

Data from the U.S. Bureau of Labor Statistics showed that the Consumer Price Index rose 0.4% month-over-month in August, bringing the annualized inflation rate to 2.9% from 2.7% in July, slightly exceeding market expectations. The core CPI rose 0.3% month-over-month, maintaining its annualized rate at 3.1%, in line with the previous reading and market expectations. However, the impact of the inflation data was overshadowed by weak labor market data. Initial jobless claims in the United States rose to their highest level since October 2021. This, coupled with last Friday's poor non-farm payroll report, further supported the Federal Reserve's more aggressive interest rate cuts.
The market has almost fully priced in three interest rate cuts this year. According to the CME FedWatch tool, traders see a 100% probability of a 25 basis point rate cut at next week's Federal Open Market Committee meeting, with further cuts expected in October and December. This expectation has pushed the 10-year Treasury yield to a five-month low and the US dollar index to its lowest level since late July.
Rising geopolitical risks provided additional support for gold. The Financial Times reported that the Trump administration will pressure the G7 to impose tougher sanctions on India for purchasing oil from Russia. Furthermore, Poland intercepted a Russian drone for the first time during the Russia-Ukraine conflict, marking the direct involvement of a NATO member state in the conflict and further escalating geopolitical tensions.
From the daily technical analysis, spot gold shows a typical upward trend. The price continues to climb along the trend line, providing strong dynamic support for the bull market.
The Bollinger Bands indicator shows that prices briefly broke through the upper band, and the band continues to expand, reflecting increased market volatility and the possibility of trend continuation. The strong rebound from the middle band of the Bollinger Bands indicates that bullish forces are dominant and the upward trend is expected to continue in the short term.
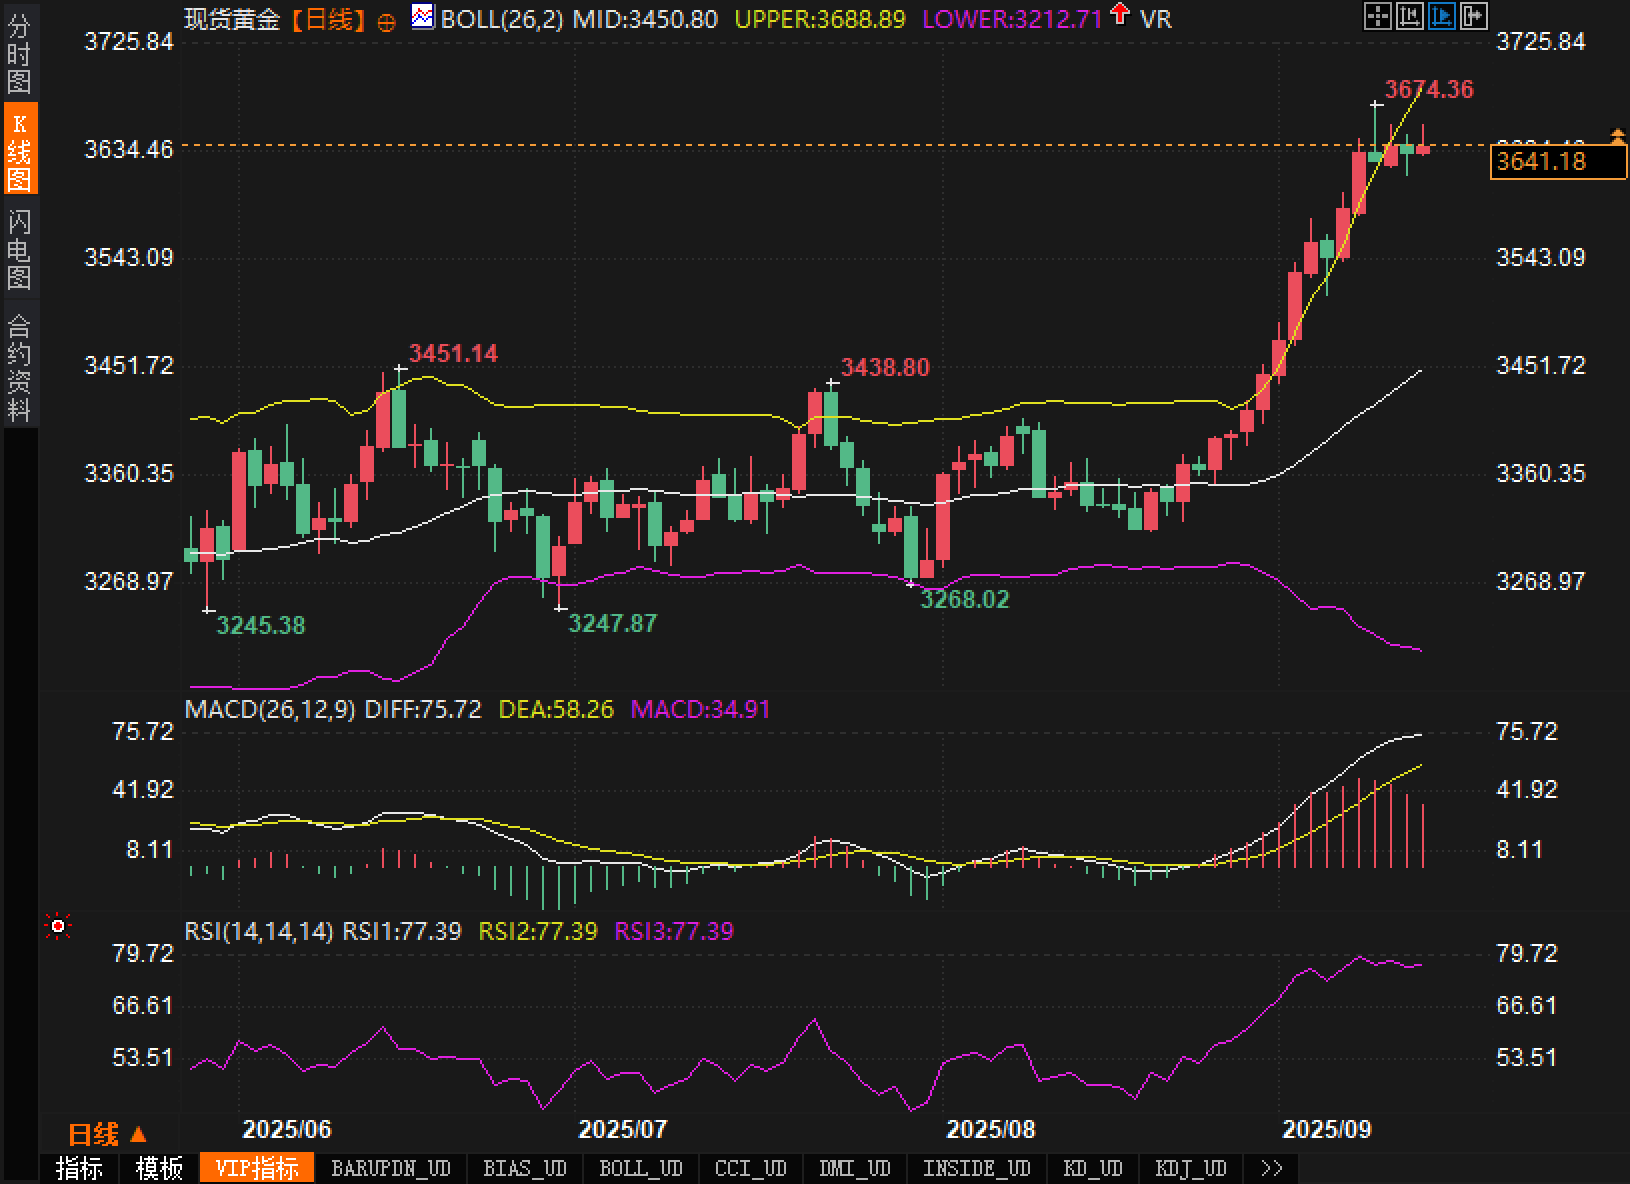
Regarding the MACD indicator, the DIFF line is at 75.72, the DEA line is at 58.26, and the MACD histogram is at 34.91, all of which are in strong territory above the zero axis. The golden cross signal between the DIFF and DEA lines has continued to expand since its establishment in late August, and the histogram has remained positive for several consecutive trading days, indicating that bullish momentum is accelerating. Notably, the MACD indicator has not yet shown a clear top divergence signal, suggesting that the current upward trend has room to continue.
The RSI (Relative Strength Index) currently stands at 77.39, indicating overbought territory but not yet reaching extreme overbought levels. Historically, the RSI can remain in overbought territory for extended periods during strong bullish markets, so a simple overbought signal alone is not sufficient for an immediate reversal.
From the perspective of key price levels, the historical high of $3674.36 has become an important psychological barrier and technical resistance level. On the downside, the $3630 range provides near-term support, which corresponds to the previous breakthrough level and short-term moving average support. Deeper support is located around $3580-3600.
The current market exhibits a typical divergence in risk appetite. On the one hand, safe-haven assets such as gold are in high demand, reflecting market concerns about geopolitical risks and economic uncertainty. On the other hand, the equity market remains relatively stable overall, demonstrating a positive market response to expectations of loose monetary policy. This divergence suggests a complex state of market sentiment, characterized by a combination of cautious optimism and risk aversion.
From the perspective of capital flows, precious metals ETFs have recorded net inflows for several consecutive weeks, indicating continued strengthening demand for gold allocations from institutional and long-term investors. Meanwhile, long positions in the futures market have reached a new high, indicating traders' optimism about the future of gold. However, caution is warranted as overly consistent bullish expectations may pose the risk of a short-term correction.
Bullish Outlook: From a medium- to long-term perspective, the onset of a global central bank's easing monetary policy cycle provides strong fundamental support for gold. The gradual realization of the Federal Reserve's expected rate cuts will continue to suppress the dollar's strength, creating a more favorable environment for dollar-denominated gold to rise. The continued escalation of geopolitical risks and concerns about slowing global economic growth will maintain market demand for safe-haven assets. Technically, price continuation after breaking through historical highs is generally strong, and the next target may be in the $3,750-3,800 range.
Bearish Outlook: The risk of a technical correction in the short term warrants attention. The RSI indicator has reached overbought levels, and the price is far from key moving averages, suggesting a technical sign of mean reversion. If US economic data shows an unexpected improvement or the Fed cuts interest rates less than expected, profit-taking could be triggered. Furthermore, the rapid rise in gold prices has attracted a significant amount of short-term speculative capital, and the withdrawal of this capital could exacerbate price volatility. Key support lies at the $3,600 mark; a break below this level could trigger a deeper technical correction, targeting the $3,550-3,580 range.
A comprehensive analysis of fundamental and technical factors indicates that the gold market is currently dominated by bulls. While there is a possibility of short-term technical adjustments, the foundation for the medium- to long-term upward trend remains solid. Traders are closely monitoring the Federal Reserve's policy statements, geopolitical developments, and the effectiveness of key technical levels.
Fundamentals
Data from the U.S. Bureau of Labor Statistics showed that the Consumer Price Index rose 0.4% month-over-month in August, bringing the annualized inflation rate to 2.9% from 2.7% in July, slightly exceeding market expectations. The core CPI rose 0.3% month-over-month, maintaining its annualized rate at 3.1%, in line with the previous reading and market expectations. However, the impact of the inflation data was overshadowed by weak labor market data. Initial jobless claims in the United States rose to their highest level since October 2021. This, coupled with last Friday's poor non-farm payroll report, further supported the Federal Reserve's more aggressive interest rate cuts.
The market has almost fully priced in three interest rate cuts this year. According to the CME FedWatch tool, traders see a 100% probability of a 25 basis point rate cut at next week's Federal Open Market Committee meeting, with further cuts expected in October and December. This expectation has pushed the 10-year Treasury yield to a five-month low and the US dollar index to its lowest level since late July.
Rising geopolitical risks provided additional support for gold. The Financial Times reported that the Trump administration will pressure the G7 to impose tougher sanctions on India for purchasing oil from Russia. Furthermore, Poland intercepted a Russian drone for the first time during the Russia-Ukraine conflict, marking the direct involvement of a NATO member state in the conflict and further escalating geopolitical tensions.
Technical aspects
From the daily technical analysis, spot gold shows a typical upward trend. The price continues to climb along the trend line, providing strong dynamic support for the bull market.
The Bollinger Bands indicator shows that prices briefly broke through the upper band, and the band continues to expand, reflecting increased market volatility and the possibility of trend continuation. The strong rebound from the middle band of the Bollinger Bands indicates that bullish forces are dominant and the upward trend is expected to continue in the short term.
Regarding the MACD indicator, the DIFF line is at 75.72, the DEA line is at 58.26, and the MACD histogram is at 34.91, all of which are in strong territory above the zero axis. The golden cross signal between the DIFF and DEA lines has continued to expand since its establishment in late August, and the histogram has remained positive for several consecutive trading days, indicating that bullish momentum is accelerating. Notably, the MACD indicator has not yet shown a clear top divergence signal, suggesting that the current upward trend has room to continue.
The RSI (Relative Strength Index) currently stands at 77.39, indicating overbought territory but not yet reaching extreme overbought levels. Historically, the RSI can remain in overbought territory for extended periods during strong bullish markets, so a simple overbought signal alone is not sufficient for an immediate reversal.
From the perspective of key price levels, the historical high of $3674.36 has become an important psychological barrier and technical resistance level. On the downside, the $3630 range provides near-term support, which corresponds to the previous breakthrough level and short-term moving average support. Deeper support is located around $3580-3600.
Market Sentiment Observation
The current market exhibits a typical divergence in risk appetite. On the one hand, safe-haven assets such as gold are in high demand, reflecting market concerns about geopolitical risks and economic uncertainty. On the other hand, the equity market remains relatively stable overall, demonstrating a positive market response to expectations of loose monetary policy. This divergence suggests a complex state of market sentiment, characterized by a combination of cautious optimism and risk aversion.
From the perspective of capital flows, precious metals ETFs have recorded net inflows for several consecutive weeks, indicating continued strengthening demand for gold allocations from institutional and long-term investors. Meanwhile, long positions in the futures market have reached a new high, indicating traders' optimism about the future of gold. However, caution is warranted as overly consistent bullish expectations may pose the risk of a short-term correction.
Market Outlook
Bullish Outlook: From a medium- to long-term perspective, the onset of a global central bank's easing monetary policy cycle provides strong fundamental support for gold. The gradual realization of the Federal Reserve's expected rate cuts will continue to suppress the dollar's strength, creating a more favorable environment for dollar-denominated gold to rise. The continued escalation of geopolitical risks and concerns about slowing global economic growth will maintain market demand for safe-haven assets. Technically, price continuation after breaking through historical highs is generally strong, and the next target may be in the $3,750-3,800 range.
Bearish Outlook: The risk of a technical correction in the short term warrants attention. The RSI indicator has reached overbought levels, and the price is far from key moving averages, suggesting a technical sign of mean reversion. If US economic data shows an unexpected improvement or the Fed cuts interest rates less than expected, profit-taking could be triggered. Furthermore, the rapid rise in gold prices has attracted a significant amount of short-term speculative capital, and the withdrawal of this capital could exacerbate price volatility. Key support lies at the $3,600 mark; a break below this level could trigger a deeper technical correction, targeting the $3,550-3,580 range.
A comprehensive analysis of fundamental and technical factors indicates that the gold market is currently dominated by bulls. While there is a possibility of short-term technical adjustments, the foundation for the medium- to long-term upward trend remains solid. Traders are closely monitoring the Federal Reserve's policy statements, geopolitical developments, and the effectiveness of key technical levels.
- Risk Warning and Disclaimer
- The market involves risk, and trading may not be suitable for all investors. This article is for reference only and does not constitute personal investment advice, nor does it take into account certain users’ specific investment objectives, financial situation, or other needs. Any investment decisions made based on this information are at your own risk.