Wahaha spot price plummets to -1.26, signaling another bottleneck for US gas
2025-09-15 21:59:40
On Monday (September 15th), spot natural gas prices at the Wahah hub plummeted again, plummeting to -$1.261 per million British thermal units (mmBtu). This marked a sharp drop from approximately $0.06 on Friday, a single-day drop of over 2,350%, hitting a near 17-week low. The direct cause of the negative prices remains autumn pipeline maintenance and transportation restrictions, which have resulted in the forced storage of natural gas within the basin. Meanwhile, LSEG data shows that average production in the lower 48 states has fallen to 107.6 bcfd so far in September, down from a record high of 108.3 bcfd in August, adding to the fundamentals behind this round of volatility.

Negative prices aren't a sudden collapse in demand, but rather a typical "regional squeeze" caused by pipeline bottlenecks and seasonal maintenance. Traders generally point to autumn maintenance temporarily reducing some Waha export capacity, forcing spot traders to "buy transport" at negative prices. Statistics for the year indicate that the average Waha price has fallen below zero for the sixth time in 2025; this has occurred 17 times in 2019, 6 times in 2020, once in 2023, and a record 49 times in 2024. In other words, negative prices are a structural feature of the hub, driven by high oil and gas co-production and tight pipeline transportation margins, rather than a black swan event.
On the production side, although daily production dipped slightly to 107.6 bcfd in September, it remains historically high compared to recent peaks. Basin-wide associated gas releases remain robust, while recent oil price declines of approximately -12% year-to-date have forced some shale oil companies to plan capital expenditure cuts. If this strategy continues, it could slow associated gas growth in the longer term, creating a hysteresis constraint on the frequency of negative Wahaha prices. In the short term, the gap between high supply and weak export volumes will continue to dominate spot price fluctuations.
Mid-term solutions are on the horizon for pipeline transportation: new lines such as Kinder Morgan's Gulf Coast Express expansion, the WPC joint venture Blackcomb, and Energy Transfer's Hugh Brinson are under construction, but are not expected to be operational before 2026. This means that Waha's "bottleneck and negative price cycle" is likely to recur for at least the next year or so. At the regional basis level, research and industry analysts generally believe that Waha's deeply negative basis with Henry Hub is likely to continue until 2026.
Since the second quarter, the Wahha spot price has generally exhibited a pattern of "high-level fluctuations, gradual decline, and sharp decline." In May, it peaked at $2.0-2.5, then retreated several times in July. Since August, it has maintained a horizontal range of $1.0-1.5. Recently, it has rapidly retreated to near zero, then directly broke through the zero axis in mid-September, dropping to -1.261. This decline combines the characteristics of "trend acceleration" and "volatility expansion," constituting a typical "volume breakout" driven by volume (i.e., supply and demand squeeze).
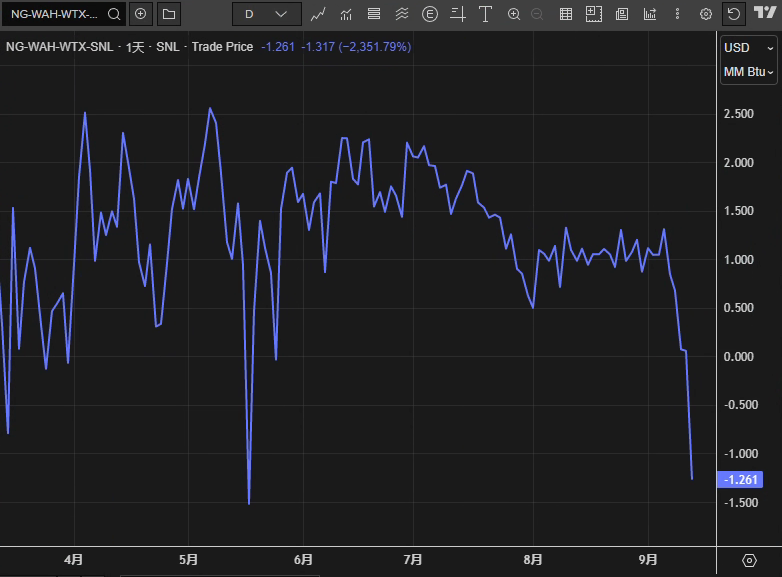
Support/Resistance: The zero axis ($0/mmBtu) has changed from support to resistance. The short-term upper resistance looks to the dense trading area of $0-0.20. The downward static support refers to the historical extreme band around -$1.50 (the corresponding range of the extreme lower shadow that appeared in May), followed by the psychological level of -$1.80.
Pattern and Rhythm: The current trend can be seen as an acceleration phase from a "downward breakout" of the August trading range into a "downward channel." A short-term technical rebound may occur during a "retracement" of the price to the zero axis. However, if the retracement fails to hold, it could easily become a "false breakout followed by further downward pressure." Until a clear "V-shaped" or "island-shaped" reversal is seen, trend-based bears remain dominant.
Short-term (several days to two weeks): If pipeline maintenance continues and outflow capacity from the basin is difficult to quickly restore, negative prices may persist for a period of time. Once some of the repaired sections resume service, prices are expected to retest the zero axis, triggering a technical rebound, but are likely to encounter selling pressure in the $0-0.20 resistance zone. With intraday volatility remaining high, the probability of alternating "dead cat bounces" and "rapid pullbacks" increases.
Medium-term (1-3 months): Seasonal drivers will begin to shift. If warmer weather persists into late autumn, demand will be limited, while production remains elevated. Fundamental improvement in the negative basis structure will be difficult. Conversely, if crude oil prices remain depressed, suppressing capital expenditures and slowing associated gas growth, the frequency of negative prices may decrease in the medium term. However, this will likely reflect a decrease in extreme events rather than a significant rebound in the price center.
Long-term (around 2026): If the aforementioned new pipelines come online as planned, Waha's structural bottlenecks will be significantly alleviated. By then, regional prices are expected to stabilize at a "deeply negative basis but rarely negative prices," with the spot curve closer to mean reversion. Prior to this, the market will continue to undergo a cycle of "periodic negative prices, recovery, and renewed negative prices."
Key risks:
1) Maintenance progress is slower than expected, or a sudden outage causes a "secondary fermentation of the bottleneck"; 2) Extreme weather changes the demand curve; 3) Sharp fluctuations in oil prices trigger rapid adjustments in the number of drilling rigs and the pace of completions, changing the momentum of associated gas; 4) External pull changes caused by the start-up and shutdown of LNG units.
Fundamentals
Negative prices aren't a sudden collapse in demand, but rather a typical "regional squeeze" caused by pipeline bottlenecks and seasonal maintenance. Traders generally point to autumn maintenance temporarily reducing some Waha export capacity, forcing spot traders to "buy transport" at negative prices. Statistics for the year indicate that the average Waha price has fallen below zero for the sixth time in 2025; this has occurred 17 times in 2019, 6 times in 2020, once in 2023, and a record 49 times in 2024. In other words, negative prices are a structural feature of the hub, driven by high oil and gas co-production and tight pipeline transportation margins, rather than a black swan event.
On the production side, although daily production dipped slightly to 107.6 bcfd in September, it remains historically high compared to recent peaks. Basin-wide associated gas releases remain robust, while recent oil price declines of approximately -12% year-to-date have forced some shale oil companies to plan capital expenditure cuts. If this strategy continues, it could slow associated gas growth in the longer term, creating a hysteresis constraint on the frequency of negative Wahaha prices. In the short term, the gap between high supply and weak export volumes will continue to dominate spot price fluctuations.
Mid-term solutions are on the horizon for pipeline transportation: new lines such as Kinder Morgan's Gulf Coast Express expansion, the WPC joint venture Blackcomb, and Energy Transfer's Hugh Brinson are under construction, but are not expected to be operational before 2026. This means that Waha's "bottleneck and negative price cycle" is likely to recur for at least the next year or so. At the regional basis level, research and industry analysts generally believe that Waha's deeply negative basis with Henry Hub is likely to continue until 2026.
Technical aspects:
Since the second quarter, the Wahha spot price has generally exhibited a pattern of "high-level fluctuations, gradual decline, and sharp decline." In May, it peaked at $2.0-2.5, then retreated several times in July. Since August, it has maintained a horizontal range of $1.0-1.5. Recently, it has rapidly retreated to near zero, then directly broke through the zero axis in mid-September, dropping to -1.261. This decline combines the characteristics of "trend acceleration" and "volatility expansion," constituting a typical "volume breakout" driven by volume (i.e., supply and demand squeeze).
Support/Resistance: The zero axis ($0/mmBtu) has changed from support to resistance. The short-term upper resistance looks to the dense trading area of $0-0.20. The downward static support refers to the historical extreme band around -$1.50 (the corresponding range of the extreme lower shadow that appeared in May), followed by the psychological level of -$1.80.
Pattern and Rhythm: The current trend can be seen as an acceleration phase from a "downward breakout" of the August trading range into a "downward channel." A short-term technical rebound may occur during a "retracement" of the price to the zero axis. However, if the retracement fails to hold, it could easily become a "false breakout followed by further downward pressure." Until a clear "V-shaped" or "island-shaped" reversal is seen, trend-based bears remain dominant.
Market Outlook
Short-term (several days to two weeks): If pipeline maintenance continues and outflow capacity from the basin is difficult to quickly restore, negative prices may persist for a period of time. Once some of the repaired sections resume service, prices are expected to retest the zero axis, triggering a technical rebound, but are likely to encounter selling pressure in the $0-0.20 resistance zone. With intraday volatility remaining high, the probability of alternating "dead cat bounces" and "rapid pullbacks" increases.
Medium-term (1-3 months): Seasonal drivers will begin to shift. If warmer weather persists into late autumn, demand will be limited, while production remains elevated. Fundamental improvement in the negative basis structure will be difficult. Conversely, if crude oil prices remain depressed, suppressing capital expenditures and slowing associated gas growth, the frequency of negative prices may decrease in the medium term. However, this will likely reflect a decrease in extreme events rather than a significant rebound in the price center.
Long-term (around 2026): If the aforementioned new pipelines come online as planned, Waha's structural bottlenecks will be significantly alleviated. By then, regional prices are expected to stabilize at a "deeply negative basis but rarely negative prices," with the spot curve closer to mean reversion. Prior to this, the market will continue to undergo a cycle of "periodic negative prices, recovery, and renewed negative prices."
Key risks:
1) Maintenance progress is slower than expected, or a sudden outage causes a "secondary fermentation of the bottleneck"; 2) Extreme weather changes the demand curve; 3) Sharp fluctuations in oil prices trigger rapid adjustments in the number of drilling rigs and the pace of completions, changing the momentum of associated gas; 4) External pull changes caused by the start-up and shutdown of LNG units.
- Risk Warning and Disclaimer
- The market involves risk, and trading may not be suitable for all investors. This article is for reference only and does not constitute personal investment advice, nor does it take into account certain users’ specific investment objectives, financial situation, or other needs. Any investment decisions made based on this information are at your own risk.