The dot plot shows 3.6%, but the market is hesitant: where will gold go next?
2025-09-19 19:53:42
Spot gold prices fluctuated around $3,650 before the US market opened on Friday (September 19th). After hitting a record high of $3,707.35 on Wednesday, prices remained under pressure for two consecutive days. They found buying momentum around $3,630 on Friday, before retesting $3,650. The dollar's rebound weakened during the session, allowing precious metals to rally. However, the pullback from the highs has not yet been fully absorbed, and the market's momentum has slowed compared to the previous steep upward trend.
The recent macroeconomic narrative centers on the triangle of "easing path, dollar strength, and real interest rates." On Wednesday, the Federal Reserve cut its policy rate by 25 basis points to a range of 4.00% to 4.25%, signaling continued easing this year. The dot plot shows that policymakers project a year-end rate of 3.6%. These easing expectations should have supported gold, but a short-term dollar rebound offset some of the gains. On Friday, the futures curve had almost fully priced in another 25 basis point Fed rate cut in October, with a high probability of further easing in December. However, recent better-than-expected initial jobless claims, coupled with a strong rebound in the Philadelphia Fed manufacturing index, provided temporary support for the dollar.
The US dollar index is trading around 97.60. The aforementioned data and anticipated speeches (San Francisco Fed President Mary Daly will speak early Saturday morning) have shaped a trading framework characterized by a clear direction for easing, but divergent paces. While the clear path is bullish for gold, uncertainty about the pace and the dollar's reflexive volatility are exerting downward pressure. In other words, easing expectations are the bottom line, while the pace-based debate is the top. Between these two factors, gold prices, at high levels, are entering a phase dominated by slow-moving variables.
The daily candlestick chart shows the upper Bollinger Band at 3777.56, the middle at 3510.35, and the lower at 3243.14. Since late August, prices have accelerated along the upper band, peaking at 3707.35 before retreating for two consecutive days. Overall, the market remains above the middle Bollinger Band, and this high-level "retracement-consolidation" pattern is more like a shift in momentum than an immediate reversal.
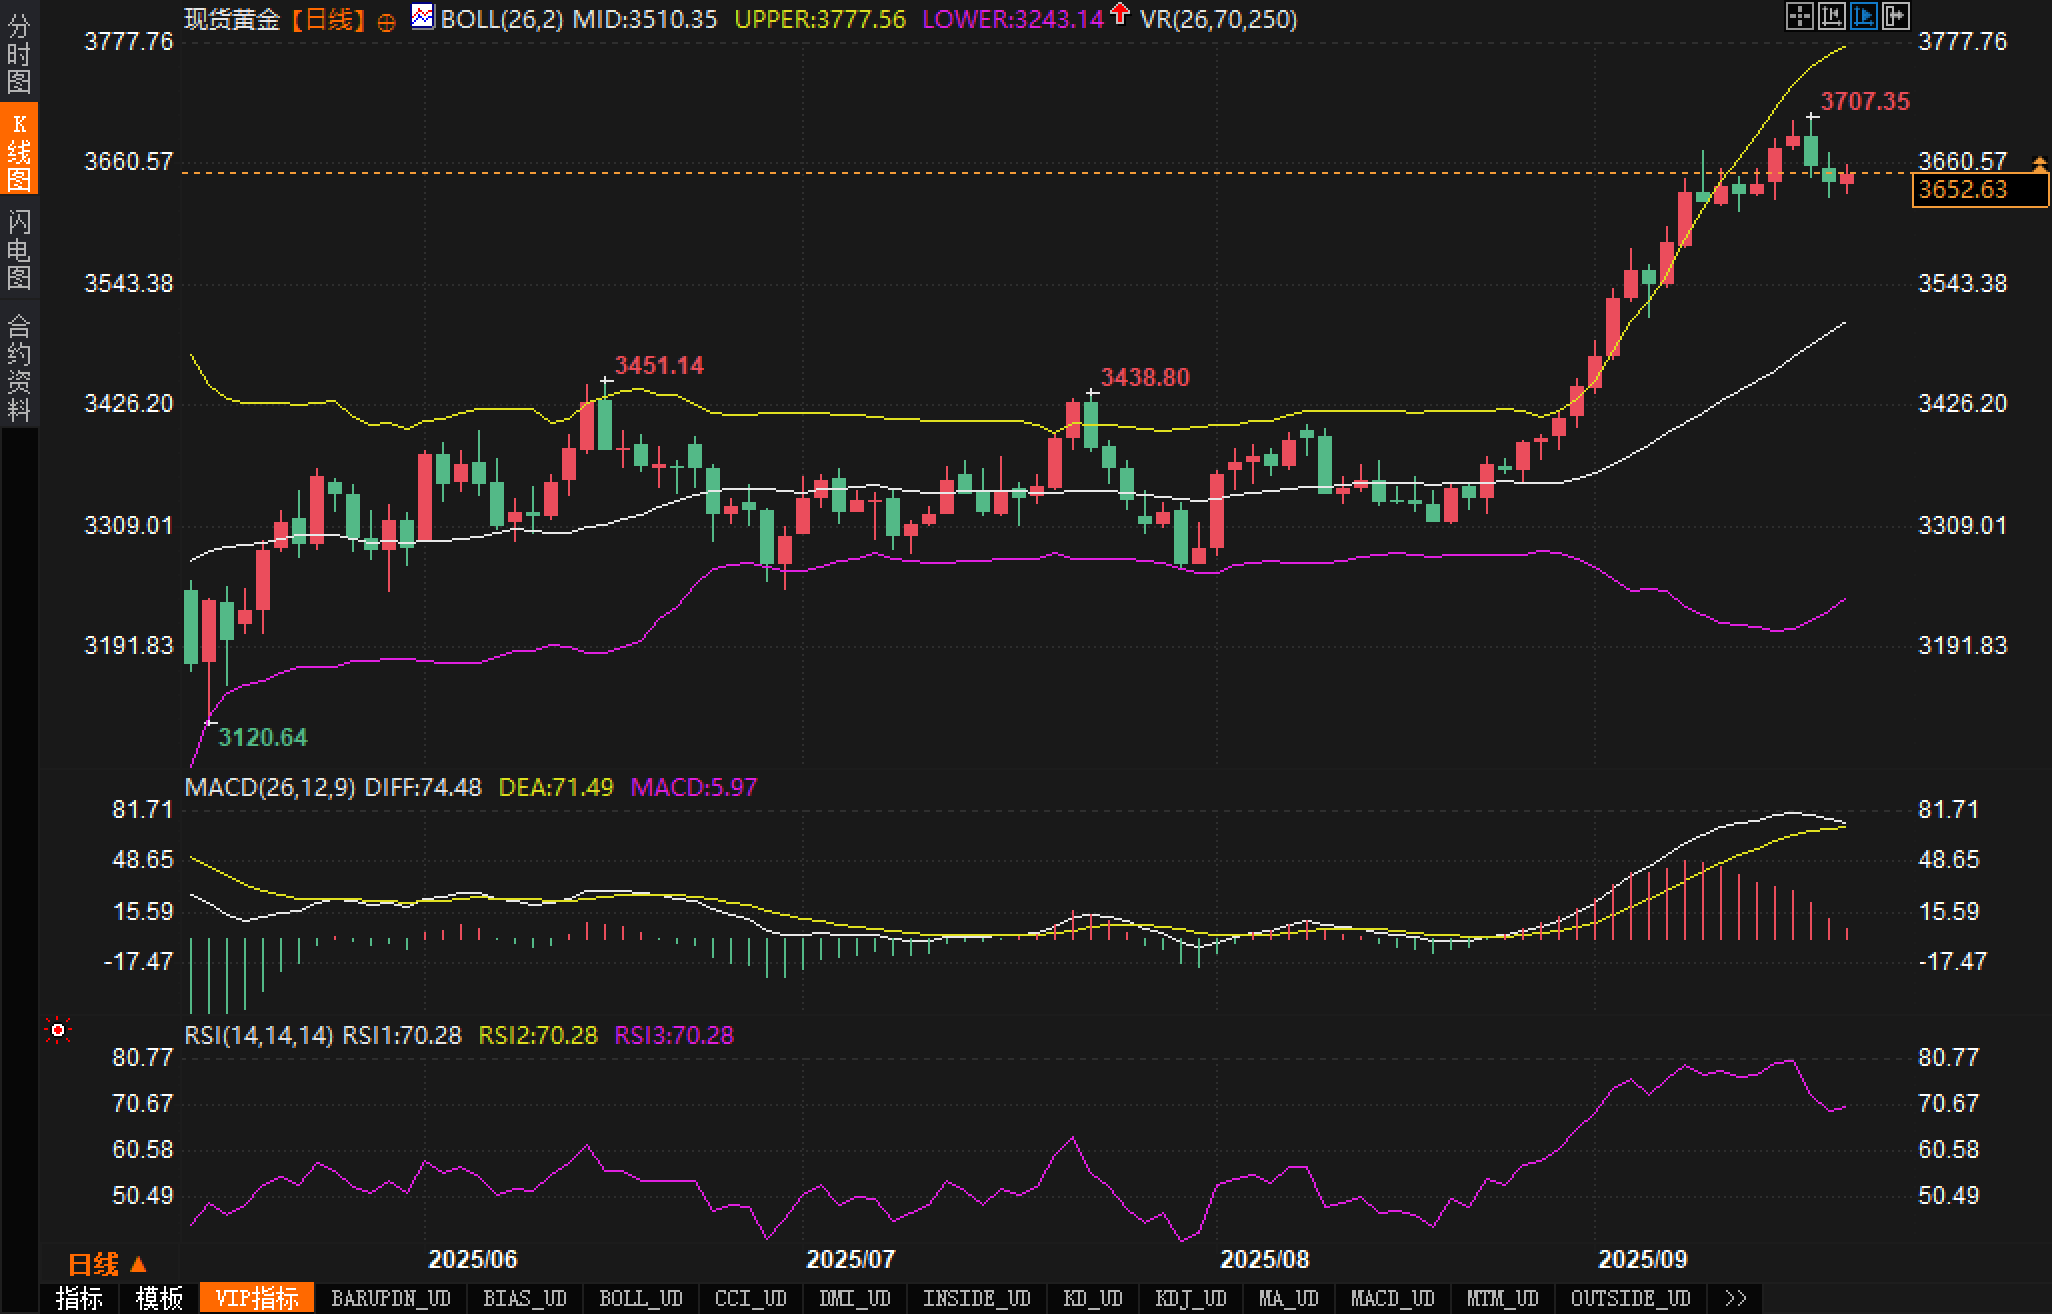
On the MACD chart, DIFF = 74.48, DEA = 71.49, and the bar chart = 5.97, remaining above the zero axis, but the red bar chart continues to shrink, indicating a weakening of upward momentum at a high level. If DIFF crosses below DEA, it will trigger a high-level death cross risk warning rather than a conclusion. Combined with the candlestick pattern, this is a healthy breather within the trend. However, if the second upward move fails to effectively break through 3707.35 and hold, caution is advised against a false breakout followed by a secondary pullback. Key levels to watch above are 3660, 3707.35, and the upper Bollinger band at 3777.56; below, watch for 3543, the middle band at 3510.35, 3426.20, and 3310.
Further analyzing the price structure: 3660, a watershed level for recent intraday trading, has repeatedly traded roles between breakouts and pullbacks. A close above this level could bolster short-term bullish momentum. If intraday weakness persists and the price breaks below 3600, the first target is the congestion zone near 3543, which forms dual static and dynamic support with the middle Bollinger band at 3510.35. A break below the middle band and a sustained trend would open the next potential long position at 3243.14-3310.
Short-term (several days to two weeks): The price's gains and losses around the 3660 level will determine whether it will "extend the upper edge of the high consolidation" or "retrace to the middle line." If the dollar's rebound remains limited and expectations for Fed interest rate cuts converge toward a "continuity" of October and December rate cuts, gold could retest 3707.35 and potentially reach 3777.56. However, if the dollar stabilizes above 97.60 and receives further data support, gold could experience a healthy pullback toward the 3543-3510.35 area to offset the overbought and congestion caused by the previous acceleration.
Mid-term (one quarter): The determining factor will return to the real interest rate trend. If the year-end level of 3.6% depicted in the dot plot gradually materializes, and employment and inflation data continue to be moderate to weak, a decline in real interest rates will provide underlying support for gold's bull market. Conversely, if the pace of easing falls short of curve pricing, or if resurgent inflation triggers a repricing of nominal interest rates, gold's mid-term trend will likely shift into a wide range of fluctuations within the rising channel, trading high-level support for time between 3510.35 and 3707.35.
Fundamentals:
The recent macroeconomic narrative centers on the triangle of "easing path, dollar strength, and real interest rates." On Wednesday, the Federal Reserve cut its policy rate by 25 basis points to a range of 4.00% to 4.25%, signaling continued easing this year. The dot plot shows that policymakers project a year-end rate of 3.6%. These easing expectations should have supported gold, but a short-term dollar rebound offset some of the gains. On Friday, the futures curve had almost fully priced in another 25 basis point Fed rate cut in October, with a high probability of further easing in December. However, recent better-than-expected initial jobless claims, coupled with a strong rebound in the Philadelphia Fed manufacturing index, provided temporary support for the dollar.
The US dollar index is trading around 97.60. The aforementioned data and anticipated speeches (San Francisco Fed President Mary Daly will speak early Saturday morning) have shaped a trading framework characterized by a clear direction for easing, but divergent paces. While the clear path is bullish for gold, uncertainty about the pace and the dollar's reflexive volatility are exerting downward pressure. In other words, easing expectations are the bottom line, while the pace-based debate is the top. Between these two factors, gold prices, at high levels, are entering a phase dominated by slow-moving variables.
Technical aspects:
The daily candlestick chart shows the upper Bollinger Band at 3777.56, the middle at 3510.35, and the lower at 3243.14. Since late August, prices have accelerated along the upper band, peaking at 3707.35 before retreating for two consecutive days. Overall, the market remains above the middle Bollinger Band, and this high-level "retracement-consolidation" pattern is more like a shift in momentum than an immediate reversal.
On the MACD chart, DIFF = 74.48, DEA = 71.49, and the bar chart = 5.97, remaining above the zero axis, but the red bar chart continues to shrink, indicating a weakening of upward momentum at a high level. If DIFF crosses below DEA, it will trigger a high-level death cross risk warning rather than a conclusion. Combined with the candlestick pattern, this is a healthy breather within the trend. However, if the second upward move fails to effectively break through 3707.35 and hold, caution is advised against a false breakout followed by a secondary pullback. Key levels to watch above are 3660, 3707.35, and the upper Bollinger band at 3777.56; below, watch for 3543, the middle band at 3510.35, 3426.20, and 3310.
Further analyzing the price structure: 3660, a watershed level for recent intraday trading, has repeatedly traded roles between breakouts and pullbacks. A close above this level could bolster short-term bullish momentum. If intraday weakness persists and the price breaks below 3600, the first target is the congestion zone near 3543, which forms dual static and dynamic support with the middle Bollinger band at 3510.35. A break below the middle band and a sustained trend would open the next potential long position at 3243.14-3310.
Market outlook:
Short-term (several days to two weeks): The price's gains and losses around the 3660 level will determine whether it will "extend the upper edge of the high consolidation" or "retrace to the middle line." If the dollar's rebound remains limited and expectations for Fed interest rate cuts converge toward a "continuity" of October and December rate cuts, gold could retest 3707.35 and potentially reach 3777.56. However, if the dollar stabilizes above 97.60 and receives further data support, gold could experience a healthy pullback toward the 3543-3510.35 area to offset the overbought and congestion caused by the previous acceleration.
Mid-term (one quarter): The determining factor will return to the real interest rate trend. If the year-end level of 3.6% depicted in the dot plot gradually materializes, and employment and inflation data continue to be moderate to weak, a decline in real interest rates will provide underlying support for gold's bull market. Conversely, if the pace of easing falls short of curve pricing, or if resurgent inflation triggers a repricing of nominal interest rates, gold's mid-term trend will likely shift into a wide range of fluctuations within the rising channel, trading high-level support for time between 3510.35 and 3707.35.
- Risk Warning and Disclaimer
- The market involves risk, and trading may not be suitable for all investors. This article is for reference only and does not constitute personal investment advice, nor does it take into account certain users’ specific investment objectives, financial situation, or other needs. Any investment decisions made based on this information are at your own risk.