With US Treasury yields falling, what will happen to the US dollar and gold tomorrow?
2025-12-03 20:35:48
On Wednesday (December 3), the global bond market was undergoing a subtle adjustment, with the core of its volatility shifting from the Eurozone to the US and Japanese markets. The 10-year US Treasury yield retreated from its recent high to 4.058%, down 0.78% on the day. This move directly drove a pullback in the US dollar index, which fell 0.37% to 98.9609. Spot gold prices fluctuated within a narrow range, remaining nearly flat on the day, trading around $4205.61 per ounce. The market is currently holding its breath awaiting the release of the US ADP private sector employment data later in the day, which will provide the latest clues for assessing the resilience of the US economy and the Federal Reserve's policy path. Meanwhile, the surge in Japanese government bond yields triggered by expectations of central bank tightening and large-scale government spending plans, while having lessened its spillover effects from the beginning of the week, remains a key variable affecting global bond market sentiment.

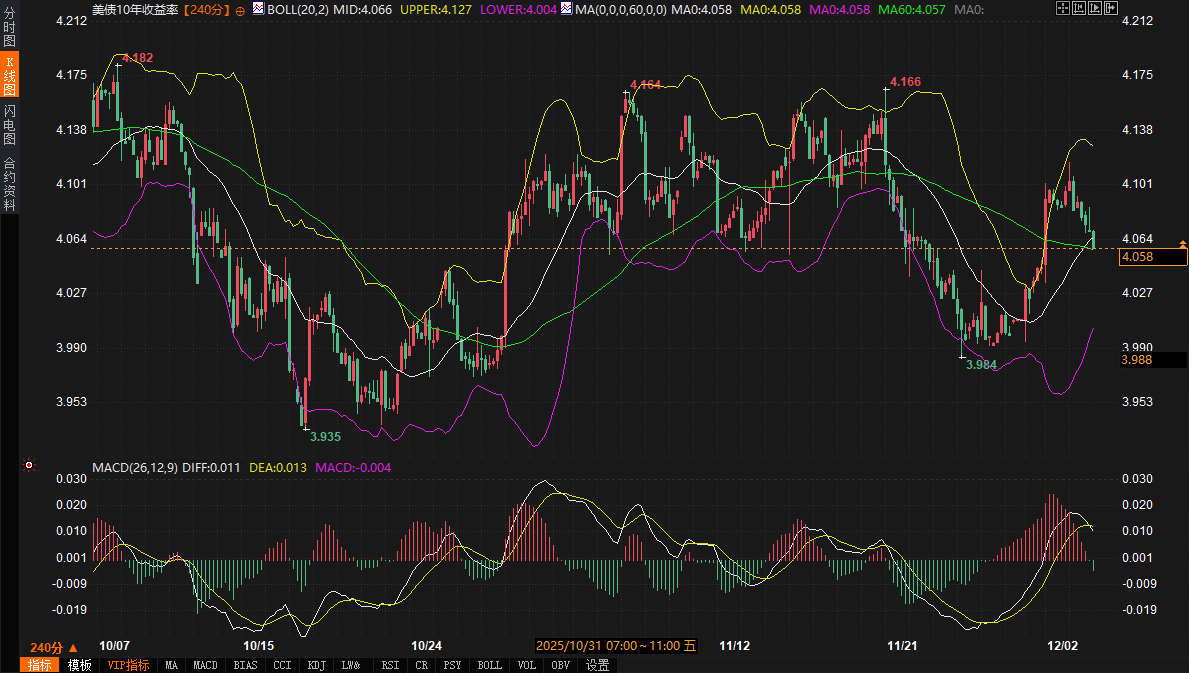
From a technical perspective, the 10-year US Treasury yield on the 240-minute chart shows a weakening of short-term upward momentum. The current price of 4.058% has broken below the Bollinger Band (parameter 20, 2) middle band at 4.066% and is moving towards the lower band at 4.004%. In the MACD indicator, the DIFF line (-0.011) has crossed below the DEA line (0.013), and although still above the zero line, the histogram has turned negative, indicating short-term downward pressure. This suggests that the yield encountered significant technical selling pressure and profit-taking after testing recent highs.
From a fundamental perspective, market caution ahead of major data releases is the main reason for the decline in yields. More noteworthy is the change in the shape of the yield curve. A well-known institution's analysis points out that, through a two-month regression analysis of 2-year and 10-year constant yields to maturity, the 10-year US Treasury bond appears to be "cheaper" by about 4.4 basis points, or equivalent to 2.0 standard deviations, relative to the beta-adjusted 2-year US Treasury bond. This suggests that the market may be adjusting its pricing for a steeper "2s/10s" yield curve. This means that although the short-term interest rate path is constrained by Federal Reserve policy, market expectations for longer-term economic growth or inflation prospects may be subtly changing, resulting in relatively less downward resistance for long-term yields compared to short-term yields.
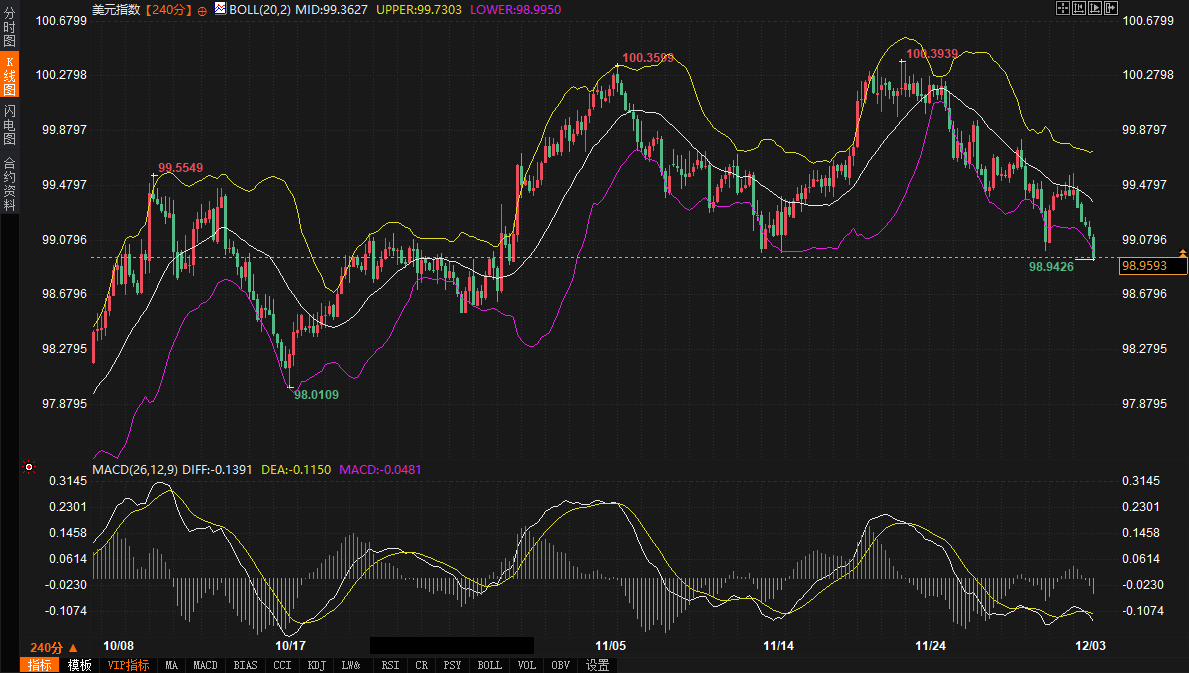
The US dollar index's immediate movement is highly synchronized with US Treasury yields. Its 240-minute chart shows that the dollar index has significantly broken below the Bollinger Band middle line at 99.3629 and is approaching the lower band near 98.9952. The MACD indicator's DIFF value (-0.1390) is lower than the DEA value (-0.1150), and both are below the zero line, indicating accumulating bearish momentum. In the short term, the 98.9950-99.000 area will be a key support zone, as it not only represents the lower Bollinger Band but also holds significant psychological importance. A decisive break below this level could open up further downside potential.
On the upside, 99.3630 (formerly the Bollinger Band middle line) will become initial resistance, with stronger resistance near the upper Bollinger Band at 99.7308. During the session, close attention should be paid to any unusual movements in US Treasury yields, especially the outcome of the struggle between the 10-year yield and the 4.00%-4.066% range, as this will directly determine whether the US dollar index gains a breather or continues its weakness. Furthermore, although recent Eurozone economic data has been strong (business activity expanded at its fastest pace in two and a half years in November) and inflation data was higher than expected (preliminary annualized overall inflation rate of 2.2% in November, and services inflation reaching 3.5%), reducing the likelihood of another rate cut by the European Central Bank in the short term, market sentiment suggests that since the ECB faces no risk of rate hikes in the next 6-12 months, its hawkish repricing of medium-term expectations and its spillover effects on long-term bonds may be "nearing their end." This limits the unilateral strength of the euro against the dollar, making the dollar's performance more concentrated on domestic factors, especially the bond market.
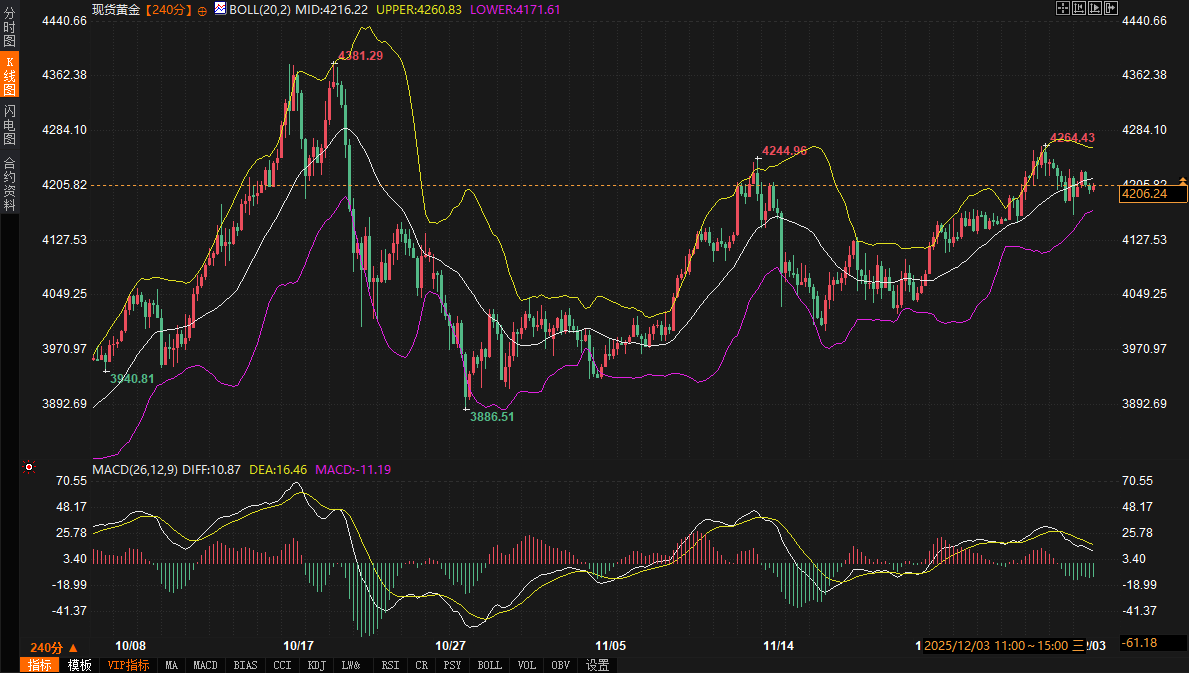
Spot gold is currently in a typical wait-and-see and balanced state. On the 240-minute chart, the gold price is trading between the Bollinger Band middle line at 4216.18 and the lower line at 4171.53, with the current price slightly below the middle line. The MACD indicator shows that although both the DIFF and DEA are positive, the DIFF (10.80) has begun to converge downwards towards the DEA (16.45), suggesting that upward momentum is weakening. In the short term, the $4170-$4175 area constitutes a key technical support zone, which coincides with the lower Bollinger Band and the previous consolidation platform. The first resistance level is near the upper Bollinger Band at $4260.83.
The current logic behind gold's price movement is not simply determined by the inverse relationship with the US dollar, but is more profoundly influenced by the safe-haven and asset allocation sentiment transmitted through fluctuations in the US Treasury market. On the one hand, the decline in US Treasury yields reduces the opportunity cost of holding gold, a non-interest-bearing asset, providing theoretical support for gold prices. On the other hand, if the decline in yields stems from increased market concerns about the economic outlook, it will simultaneously enhance gold's safe-haven appeal. However, this transmission is not linear. If the decline in yields is merely a technical correction or a minor safe-haven move before the release of strong data, its support will be limited; but if yields decline more sharply due to market concerns about economic growth or geopolitical risks (such as recent US tariff rhetoric and the ongoing Russia-Ukraine conflict), it could trigger stronger demand for gold.
In the next 48-72 hours, the market will enter a crucial data verification period. The core focus will undoubtedly be on the strength of the US employment market data (including the ADP and non-farm payroll reports). If the data shows a continued robust employment market, it could quickly reverse the decline in US Treasury yields, boosting the dollar's upward momentum and putting double pressure on gold (rising yields + a stronger dollar). Conversely, if the data shows signs of cooling, US Treasury yields may further decline, putting pressure on the dollar, while gold is expected to benefit from declining real interest rate expectations and safe-haven demand.
From a technical perspective, the US dollar index needs to hold the support level around 98.9950 to avoid a weakening of its short-term structure; the strength of its rebound depends on whether it can regain a foothold above 99.3630. The struggle around the 4.00% level and the lower Bollinger Band of the 10-year US Treasury yield is crucial, as it will set the short-term tone for global assets. For spot gold, whether it can hold above $4170 will be key to determining whether it can maintain the lower support of its recent trading range, while an upward breakout requires a clear safe-haven catalyst to drive trading volume; a move above $4260 is needed to open up new upside potential. Overall, the market is in a state of "silence" and "balance" before major data releases; any unexpected data could quickly disrupt the current delicate balance, and investors need to prepare for potentially increased volatility.
Short-term pullback in US Treasury yields: observations on slowing momentum and steepening yield curve
From a technical perspective, the 10-year US Treasury yield on the 240-minute chart shows a weakening of short-term upward momentum. The current price of 4.058% has broken below the Bollinger Band (parameter 20, 2) middle band at 4.066% and is moving towards the lower band at 4.004%. In the MACD indicator, the DIFF line (-0.011) has crossed below the DEA line (0.013), and although still above the zero line, the histogram has turned negative, indicating short-term downward pressure. This suggests that the yield encountered significant technical selling pressure and profit-taking after testing recent highs.
From a fundamental perspective, market caution ahead of major data releases is the main reason for the decline in yields. More noteworthy is the change in the shape of the yield curve. A well-known institution's analysis points out that, through a two-month regression analysis of 2-year and 10-year constant yields to maturity, the 10-year US Treasury bond appears to be "cheaper" by about 4.4 basis points, or equivalent to 2.0 standard deviations, relative to the beta-adjusted 2-year US Treasury bond. This suggests that the market may be adjusting its pricing for a steeper "2s/10s" yield curve. This means that although the short-term interest rate path is constrained by Federal Reserve policy, market expectations for longer-term economic growth or inflation prospects may be subtly changing, resulting in relatively less downward resistance for long-term yields compared to short-term yields.
US Dollar Index: Drawn by US Treasury yields, technical support faces test.
The US dollar index's immediate movement is highly synchronized with US Treasury yields. Its 240-minute chart shows that the dollar index has significantly broken below the Bollinger Band middle line at 99.3629 and is approaching the lower band near 98.9952. The MACD indicator's DIFF value (-0.1390) is lower than the DEA value (-0.1150), and both are below the zero line, indicating accumulating bearish momentum. In the short term, the 98.9950-99.000 area will be a key support zone, as it not only represents the lower Bollinger Band but also holds significant psychological importance. A decisive break below this level could open up further downside potential.
On the upside, 99.3630 (formerly the Bollinger Band middle line) will become initial resistance, with stronger resistance near the upper Bollinger Band at 99.7308. During the session, close attention should be paid to any unusual movements in US Treasury yields, especially the outcome of the struggle between the 10-year yield and the 4.00%-4.066% range, as this will directly determine whether the US dollar index gains a breather or continues its weakness. Furthermore, although recent Eurozone economic data has been strong (business activity expanded at its fastest pace in two and a half years in November) and inflation data was higher than expected (preliminary annualized overall inflation rate of 2.2% in November, and services inflation reaching 3.5%), reducing the likelihood of another rate cut by the European Central Bank in the short term, market sentiment suggests that since the ECB faces no risk of rate hikes in the next 6-12 months, its hawkish repricing of medium-term expectations and its spillover effects on long-term bonds may be "nearing their end." This limits the unilateral strength of the euro against the dollar, making the dollar's performance more concentrated on domestic factors, especially the bond market.
Spot gold: Fluctuating within a narrow range, focusing on safe-haven sentiment transmitted from the bond market.
Spot gold is currently in a typical wait-and-see and balanced state. On the 240-minute chart, the gold price is trading between the Bollinger Band middle line at 4216.18 and the lower line at 4171.53, with the current price slightly below the middle line. The MACD indicator shows that although both the DIFF and DEA are positive, the DIFF (10.80) has begun to converge downwards towards the DEA (16.45), suggesting that upward momentum is weakening. In the short term, the $4170-$4175 area constitutes a key technical support zone, which coincides with the lower Bollinger Band and the previous consolidation platform. The first resistance level is near the upper Bollinger Band at $4260.83.
The current logic behind gold's price movement is not simply determined by the inverse relationship with the US dollar, but is more profoundly influenced by the safe-haven and asset allocation sentiment transmitted through fluctuations in the US Treasury market. On the one hand, the decline in US Treasury yields reduces the opportunity cost of holding gold, a non-interest-bearing asset, providing theoretical support for gold prices. On the other hand, if the decline in yields stems from increased market concerns about the economic outlook, it will simultaneously enhance gold's safe-haven appeal. However, this transmission is not linear. If the decline in yields is merely a technical correction or a minor safe-haven move before the release of strong data, its support will be limited; but if yields decline more sharply due to market concerns about economic growth or geopolitical risks (such as recent US tariff rhetoric and the ongoing Russia-Ukraine conflict), it could trigger stronger demand for gold.
Outlook for the next 2-3 days
In the next 48-72 hours, the market will enter a crucial data verification period. The core focus will undoubtedly be on the strength of the US employment market data (including the ADP and non-farm payroll reports). If the data shows a continued robust employment market, it could quickly reverse the decline in US Treasury yields, boosting the dollar's upward momentum and putting double pressure on gold (rising yields + a stronger dollar). Conversely, if the data shows signs of cooling, US Treasury yields may further decline, putting pressure on the dollar, while gold is expected to benefit from declining real interest rate expectations and safe-haven demand.
From a technical perspective, the US dollar index needs to hold the support level around 98.9950 to avoid a weakening of its short-term structure; the strength of its rebound depends on whether it can regain a foothold above 99.3630. The struggle around the 4.00% level and the lower Bollinger Band of the 10-year US Treasury yield is crucial, as it will set the short-term tone for global assets. For spot gold, whether it can hold above $4170 will be key to determining whether it can maintain the lower support of its recent trading range, while an upward breakout requires a clear safe-haven catalyst to drive trading volume; a move above $4260 is needed to open up new upside potential. Overall, the market is in a state of "silence" and "balance" before major data releases; any unexpected data could quickly disrupt the current delicate balance, and investors need to prepare for potentially increased volatility.
- Risk Warning and Disclaimer
- The market involves risk, and trading may not be suitable for all investors. This article is for reference only and does not constitute personal investment advice, nor does it take into account certain users’ specific investment objectives, financial situation, or other needs. Any investment decisions made based on this information are at your own risk.