The bull market in gold prices continues; while there are opportunities, risks should be considered in 2026.
2025-12-13 02:17:13
This week's Federal Reserve meeting concluded, with the metals sector emerging as the biggest winner. Gold prices broke through the previously formed "bull flag" pattern and are currently gradually approaching the historical high reached last October, demonstrating strong upward resilience. Following the Fed's policy announcement, gold prices strengthened further, solidifying the bull market trend. Considering the gold market's performance over the past two years, the bull market foundation remains solid, and there is even potential for further price increases in 2026.

Core driving forces: Policy and market expectations are key.
The continued upward trend in the gold bull market is primarily driven by the deep alignment between the Federal Reserve's policy direction and market expectations. Even though the Fed meeting this week was slightly more hawkish than expected, market expectations for further easing remain, directly translating into upward pressure on gold prices. The turning point in this trend can be traced back to past policy signals: in December 2023, the Fed first signaled a rate cut in 2024, and gold prices successfully broke through the key resistance level of $2,000/ounce, which had suppressed its upward movement for the previous three and a half years, officially initiating a new round of upward movement.
Besides policy expectations, the continued accumulation of gold by central banks worldwide has become an indispensable "ballast" for the gold market. With central banks, as "core buyers," consistently entering the market, the stability of the current gold bull market trend is beyond question. Furthermore, the news two weeks ago that Trump intended to appoint the moderate Hassett as Federal Reserve Chair further strengthened market expectations for easing policies—Hassett has historically held a dovish stance, and Trump has stated that interest rate cuts are an important criterion for appointing a Fed Chair, which undoubtedly adds more confidence to the gold bull market.
Market conditions and technical analysis: Bull markets don't rise blindly; there are patterns to follow.
From a market performance perspective, gold prices have seen a continuous rise for nearly two years, with 2025 considered a bountiful year for gold bulls. Comex gold futures have already risen by approximately $1,700 this year, potentially setting a new historical high for the same period. The long-term price chart for gold has exhibited a parabolic upward trend, with the monthly chart showing an almost linear upward movement. This characteristic indicates that this multi-year bull market has entered an acceleration phase. It's worth noting that the final acceleration phase of a commodity bull market is often accompanied by a sharp surge, providing room for speculation regarding gold's future price movements.
The evolution of technical patterns provides clear evidence for the bull market, with the "bull flag" pattern being a key signal throughout this rally. Throughout this bull market, gold price pullbacks have maintained a consistent rhythm, with each consolidation forming this pattern, accumulating ample momentum for subsequent upward movement. The latest and most crucial round of pattern evolution fully presents the market's accumulation and breakout process:
In October 2025, gold prices encountered resistance twice at the $4,380 level, forming a classic "double top" pattern. This pattern ultimately led to a pullback to the $3,900 level where prices stabilized. The market then entered a symmetrical triangle consolidation phase. Considering the previous upward trend, this consolidation pattern ultimately formed a "bull flag" pattern—a pattern very similar to those formed in the last two months of last year and from April to August of this year. Following this week's Federal Reserve meeting, gold prices successfully broke through this pattern's resistance, becoming the most crucial breakout signal in the recent technical analysis.
The effectiveness of key price levels in providing support has further solidified the foundation of the bull market. The market generally considers $4200 a significant support level; even if it falls below this level in the short term, the 50-day moving average and the long-term upward trend line will provide secondary support. The current $4250 level is even more crucial: gold prices found support at $4180 multiple times in the previous week, and after the Fed meeting, bullish forces successfully pushed gold prices above $4250. This level provides strong support for further price increases before the end of the year and is a core benchmark for judging whether the bull market can continue.
What will happen to gold prices in 2026? Opportunities exist, but risks must be considered.
Looking ahead to 2026, considering the core development themes of economic growth that year and the unchanged bullish trend in gold, the price of gold is likely to rise further, and may even break through the $5,000 mark.
Beyond the optimistic expectations, risk warnings cannot be ignored. On the one hand, the "parabolic rise" pattern suggests that this multi-year bull market is nearing its end. Although a final surge is possible, the risk of a trend reversal remains. On the other hand, the market is witnessing a rare phenomenon of silver leading gold's gains—a senior analyst stated that he has never seen gold traders so closely monitoring silver's movements for directional guidance, and this correlation may continue in the coming weeks. The current silver market rally is clearly overbought, and its strong, record-breaking bull market may temporarily pause. If silver prices experience a significant correction, gold will likely face corresponding pressure.
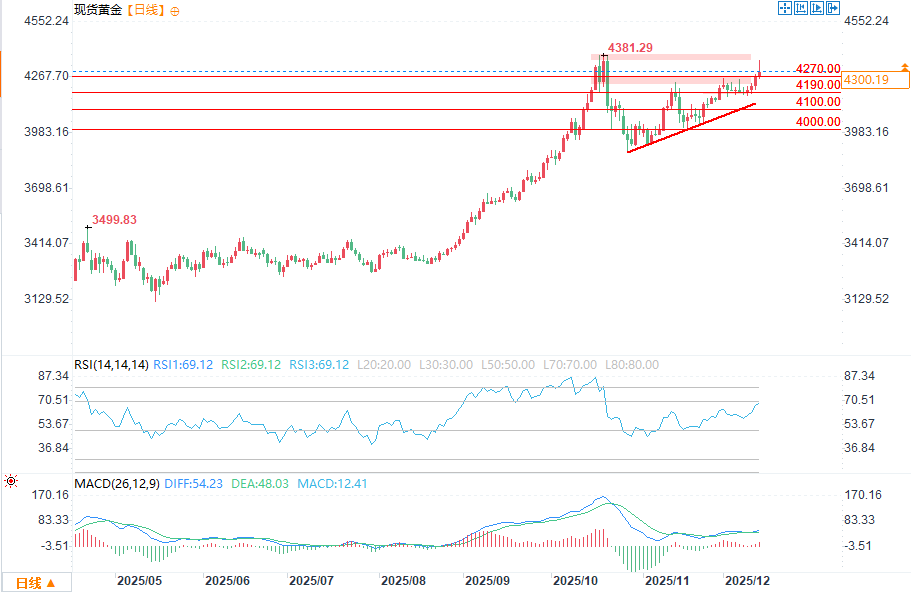
(Spot gold daily chart source: FX678)
Summarize
For market participants, gold remains in a strong bullish state, with upward momentum continuing to accumulate. Core supporting factors such as central bank gold purchases and expectations of easing policies have not fundamentally changed, and the technical outlook also confirms the continuation of the bull market trend. Short-term pullbacks can be seen as "buying on dips," which is also the core operational strategy in the current market environment.
However, it is crucial to remember that there is no absolute certainty in the market, and you should never bet all your funds on such price predictions. In practice, you should pay close attention to the effectiveness of the $4250 support level, while closely monitoring the Federal Reserve's policy moves and the silver market's performance to mitigate potential pullback risks and avoid misjudging market trends based on a single signal.
Core driving forces: Policy and market expectations are key.
The continued upward trend in the gold bull market is primarily driven by the deep alignment between the Federal Reserve's policy direction and market expectations. Even though the Fed meeting this week was slightly more hawkish than expected, market expectations for further easing remain, directly translating into upward pressure on gold prices. The turning point in this trend can be traced back to past policy signals: in December 2023, the Fed first signaled a rate cut in 2024, and gold prices successfully broke through the key resistance level of $2,000/ounce, which had suppressed its upward movement for the previous three and a half years, officially initiating a new round of upward movement.
Besides policy expectations, the continued accumulation of gold by central banks worldwide has become an indispensable "ballast" for the gold market. With central banks, as "core buyers," consistently entering the market, the stability of the current gold bull market trend is beyond question. Furthermore, the news two weeks ago that Trump intended to appoint the moderate Hassett as Federal Reserve Chair further strengthened market expectations for easing policies—Hassett has historically held a dovish stance, and Trump has stated that interest rate cuts are an important criterion for appointing a Fed Chair, which undoubtedly adds more confidence to the gold bull market.
Market conditions and technical analysis: Bull markets don't rise blindly; there are patterns to follow.
From a market performance perspective, gold prices have seen a continuous rise for nearly two years, with 2025 considered a bountiful year for gold bulls. Comex gold futures have already risen by approximately $1,700 this year, potentially setting a new historical high for the same period. The long-term price chart for gold has exhibited a parabolic upward trend, with the monthly chart showing an almost linear upward movement. This characteristic indicates that this multi-year bull market has entered an acceleration phase. It's worth noting that the final acceleration phase of a commodity bull market is often accompanied by a sharp surge, providing room for speculation regarding gold's future price movements.
The evolution of technical patterns provides clear evidence for the bull market, with the "bull flag" pattern being a key signal throughout this rally. Throughout this bull market, gold price pullbacks have maintained a consistent rhythm, with each consolidation forming this pattern, accumulating ample momentum for subsequent upward movement. The latest and most crucial round of pattern evolution fully presents the market's accumulation and breakout process:
In October 2025, gold prices encountered resistance twice at the $4,380 level, forming a classic "double top" pattern. This pattern ultimately led to a pullback to the $3,900 level where prices stabilized. The market then entered a symmetrical triangle consolidation phase. Considering the previous upward trend, this consolidation pattern ultimately formed a "bull flag" pattern—a pattern very similar to those formed in the last two months of last year and from April to August of this year. Following this week's Federal Reserve meeting, gold prices successfully broke through this pattern's resistance, becoming the most crucial breakout signal in the recent technical analysis.
The effectiveness of key price levels in providing support has further solidified the foundation of the bull market. The market generally considers $4200 a significant support level; even if it falls below this level in the short term, the 50-day moving average and the long-term upward trend line will provide secondary support. The current $4250 level is even more crucial: gold prices found support at $4180 multiple times in the previous week, and after the Fed meeting, bullish forces successfully pushed gold prices above $4250. This level provides strong support for further price increases before the end of the year and is a core benchmark for judging whether the bull market can continue.
What will happen to gold prices in 2026? Opportunities exist, but risks must be considered.
Looking ahead to 2026, considering the core development themes of economic growth that year and the unchanged bullish trend in gold, the price of gold is likely to rise further, and may even break through the $5,000 mark.
Beyond the optimistic expectations, risk warnings cannot be ignored. On the one hand, the "parabolic rise" pattern suggests that this multi-year bull market is nearing its end. Although a final surge is possible, the risk of a trend reversal remains. On the other hand, the market is witnessing a rare phenomenon of silver leading gold's gains—a senior analyst stated that he has never seen gold traders so closely monitoring silver's movements for directional guidance, and this correlation may continue in the coming weeks. The current silver market rally is clearly overbought, and its strong, record-breaking bull market may temporarily pause. If silver prices experience a significant correction, gold will likely face corresponding pressure.
(Spot gold daily chart source: FX678)
Summarize
For market participants, gold remains in a strong bullish state, with upward momentum continuing to accumulate. Core supporting factors such as central bank gold purchases and expectations of easing policies have not fundamentally changed, and the technical outlook also confirms the continuation of the bull market trend. Short-term pullbacks can be seen as "buying on dips," which is also the core operational strategy in the current market environment.
However, it is crucial to remember that there is no absolute certainty in the market, and you should never bet all your funds on such price predictions. In practice, you should pay close attention to the effectiveness of the $4250 support level, while closely monitoring the Federal Reserve's policy moves and the silver market's performance to mitigate potential pullback risks and avoid misjudging market trends based on a single signal.
- Risk Warning and Disclaimer
- The market involves risk, and trading may not be suitable for all investors. This article is for reference only and does not constitute personal investment advice, nor does it take into account certain users’ specific investment objectives, financial situation, or other needs. Any investment decisions made based on this information are at your own risk.