A divergence signal has sounded the alarm! Will this crucial final push succeed?
2025-12-15 21:49:42
On Monday (December 15), gold (XAU/USD) was in a strong consolidation pattern near its historical highs. Uncertainty surrounding the Federal Reserve's monetary policy, escalating geopolitical risks, continued gold purchases by central banks worldwide, and net inflows into gold ETFs all contributed to the core support for gold prices. Currently, gold is trading around $4339, only $42 away from the historical peak of $4381 reached on October 20, although the technical picture still shows MACD divergence.
For traders, the upcoming window of intensive US economic data releases this week will be a key catalyst influencing short-term gold price fluctuations.

The recent sharp rise in gold prices is closely related to the weakening of the US dollar index. The dollar is also pricing in several US data releases this week, including the non-farm payrolls report. At the same time, the technical indicators show that the US dollar index is still relatively weak, creating a favorable environment for gold to break through.

(US Dollar Index Daily Chart)
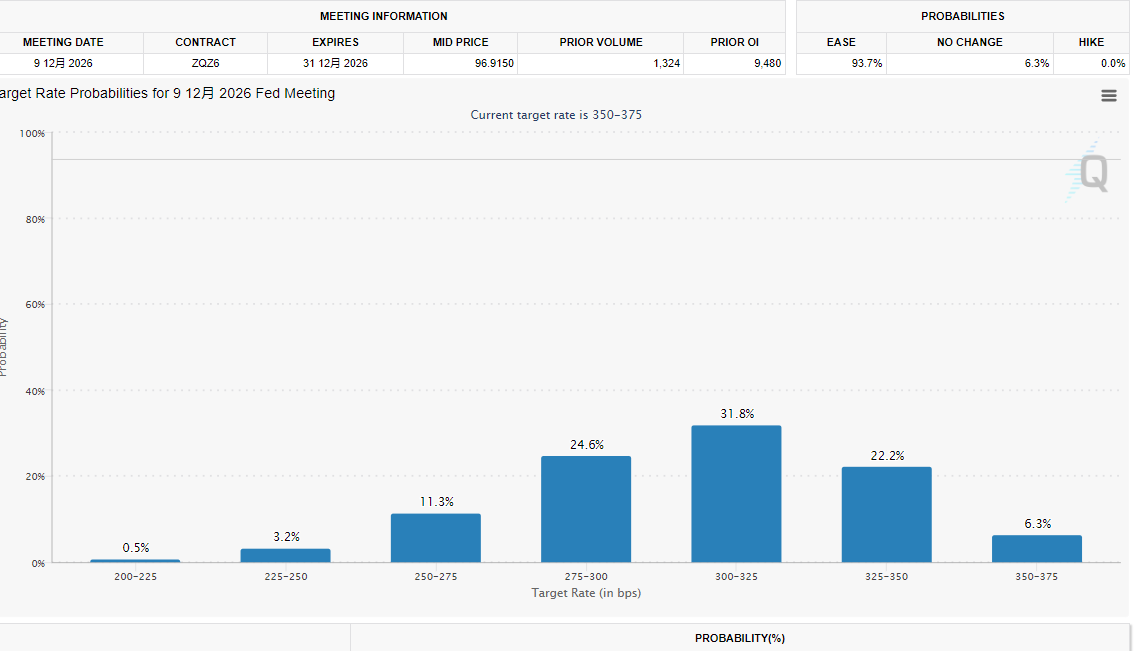
The Federal Reserve implemented a 25-basis-point rate cut last week by a 9-3 vote, lowering the policy rate to the 3.50%-3.75% range, but signaled a "wait-and-see" approach to easing.
Policymakers need to strike a balance between a weak labor market and sticky inflation. The pace of subsequent easing remains unclear. Powell's dovish remarks at the post-meeting press conference have led the market to price in two rate cuts in 2026, which is different from the one rate cut shown in the Fed's dot plot. In other words, the dot plot and interest rate futures have diverged.
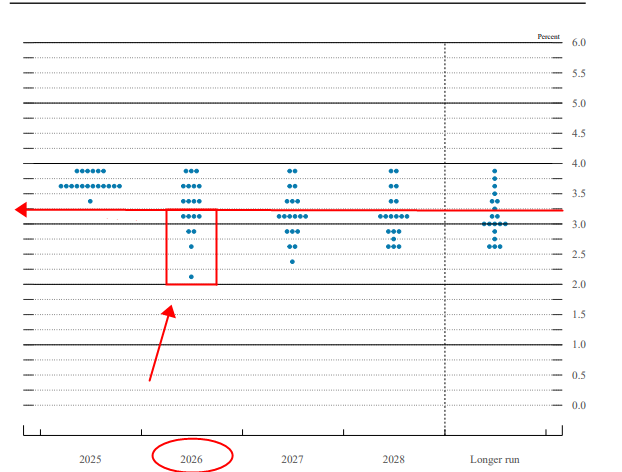
(The dot plot shows that the vote for interest rates below 3.25% in 2026 is 8/19, not exceeding 50%, while interest rate futures show more than 70%)
The divergent stances of the three dissenting committee members (two opposed interest rate cuts, while one advocated for a substantial 50-basis-point cut) further exacerbated the ambiguity of the policy path, prompting traders to increase their allocation to defensive assets such as gold.
The normalization of gold purchases by central banks around the world and the continuous net inflows into gold ETFs have provided stable upward momentum for gold prices.
From a technical perspective, after stabilizing near historical highs, gold subsequently rose for five consecutive trading days, breaking through the key support/resistance level of 4236. The upward divergence of moving averages is a typical breakout pattern.
US-led peace talks between Russia and Ukraine have stalled. Ukrainian President Zelensky proposed "abandoning NATO membership" in exchange for Western security guarantees. Although this touched on Russia's core demands, the stalemate over the territorial issue has kept geopolitical risks at a high level.
Gold prices may take advantage of the upcoming US data releases , with the US releasing a series of key data this week, including the non-farm payrolls report (NFP), consumer price index (CPI), retail sales data, and unemployment rate report. Each of these data points could trigger significant fluctuations in gold prices and become a key basis for trading decisions.
Non-farm payrolls report: The interplay between employment momentum and expectations of interest rate cuts
As one of the most closely watched economic indicators, the non-farm payroll report was delayed by 11 days due to the US government shutdown, adding extra market attention and volatility pressure. The market expected only 50,000 new jobs, far lower than last month's 119,000. If the data is released, it will signify a clear slowdown in job growth momentum. For gold trading:
If the data is weaker than expected, it will strengthen market expectations for an earlier rate cut by the Federal Reserve, weaken the attractiveness of the US dollar and US Treasury yields, drive up demand for gold as a safe haven, and the price of gold is expected to break through $4,350 and move toward historical highs.
If the data is stronger than expected, it means the labor market remains resilient, inflationary pressures may remain high, expectations for a Fed rate cut will cool, and gold prices may face downward pressure. The support level of $4,300 should be closely watched. In addition, traders should also focus on employment trends and wage growth data in key sectors such as technology and healthcare—slower wage growth will signal easing inflation, which is beneficial for gold; conversely, it may suppress gold price increases.
Retail Sales and Unemployment Rate: Signs of Consumer Resilience and Economic Slowdown
The upcoming core retail sales report is expected to show a growth rate of 0.2%. If the data falls short of expectations, it will indicate a slowdown in household spending growth, forcing businesses to adopt prudent strategies and reinforcing expectations that the Federal Reserve will cut interest rates to support the economy, thus providing support for gold. Conversely, strong consumer resilience may weaken expectations of further easing, putting downward pressure on gold prices.
Unemployment rate data is also crucial.
The market expects the unemployment rate to rise slightly from 4.4% to 4.5%, a subtle change that suggests the labor market may be entering an easing cycle. For gold trading, rising unemployment will increase the probability of the Federal Reserve cutting interest rates earlier than expected, pushing down bond yields and benefiting demand for gold. However, structural impacts should be noted—pressure on consumer-driven sectors may indirectly transmit to risk asset sentiment, and significant stock market volatility could trigger a short-term sell-off in gold.
CPI data: The final "test" of inflation stickiness.
Thursday's Consumer Price Index (CPI) release will directly test inflation stickiness. If inflation data falls, it will open up room for the Federal Reserve to further cut interest rates, increasing the attractiveness of gold as an inflation hedge; if inflation remains above the policy target, it may limit the extent of rate cuts, and the upward pace of gold prices may slow.
Gold had previously hesitated to rise, waiting for the 5, 10, 20, and 30-day moving averages to complete their adjustment before breaking through. At the same time, due to sufficient consolidation below the important level of 4236, the breakout was smooth. The pullback in gold prices last Friday indicates that the price had completed a one-day pullback after the breakout, which also shows that the major players in the gold market are in a tight timeframe and have an urgent task to complete the rise before the Fed's interest rate cut and the important non-farm payroll data release.
Meanwhile, the MACD indicator suggests a risk of divergence if gold prices reach new highs. Coupled with the hesitant rise and nimble pullbacks in gold's recent upward movement, this breakout remains highly questionable.
The recent two-day rise in gold prices is likely a reaction to the data. Once the non-farm payroll data is released, prices will begin to fall back. The price action will likely see a rapid breakout towards new highs, followed by a pullback and consolidation due to divergence, or it may not break through to new highs but instead slowly rise along the upward trend while waiting for the MACD to correct. We can wait and see.
Support levels are at the middle and lower rails of the channel, as well as the 5-day moving average. Resistance levels are at 4353 and 4381, which are also the upper rails of the channel.
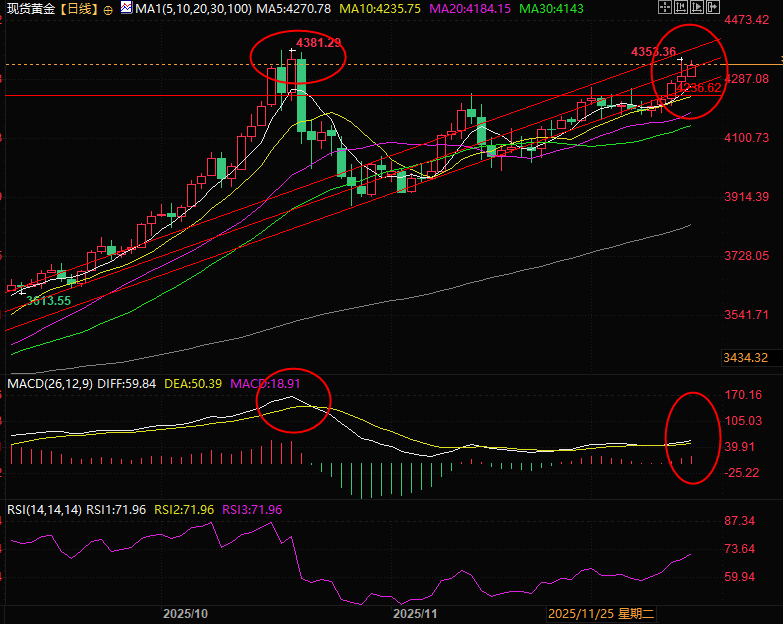
(Spot gold daily chart, source: FX678)
At 21:38 Beijing time, spot gold was trading at $4,340 per ounce.
For traders, the upcoming window of intensive US economic data releases this week will be a key catalyst influencing short-term gold price fluctuations.
Keep an eye on the US dollar index, a signal for gold prices.
The recent sharp rise in gold prices is closely related to the weakening of the US dollar index. The dollar is also pricing in several US data releases this week, including the non-farm payrolls report. At the same time, the technical indicators show that the US dollar index is still relatively weak, creating a favorable environment for gold to break through.
(US Dollar Index Daily Chart)
Federal Reserve policy uncertainty drives safe-haven allocation
The Federal Reserve implemented a 25-basis-point rate cut last week by a 9-3 vote, lowering the policy rate to the 3.50%-3.75% range, but signaled a "wait-and-see" approach to easing.
Policymakers need to strike a balance between a weak labor market and sticky inflation. The pace of subsequent easing remains unclear. Powell's dovish remarks at the post-meeting press conference have led the market to price in two rate cuts in 2026, which is different from the one rate cut shown in the Fed's dot plot. In other words, the dot plot and interest rate futures have diverged.
(The dot plot shows that the vote for interest rates below 3.25% in 2026 is 8/19, not exceeding 50%, while interest rate futures show more than 70%)
The divergent stances of the three dissenting committee members (two opposed interest rate cuts, while one advocated for a substantial 50-basis-point cut) further exacerbated the ambiguity of the policy path, prompting traders to increase their allocation to defensive assets such as gold.
Funding and technical factors work together to provide support.
The normalization of gold purchases by central banks around the world and the continuous net inflows into gold ETFs have provided stable upward momentum for gold prices.
From a technical perspective, after stabilizing near historical highs, gold subsequently rose for five consecutive trading days, breaking through the key support/resistance level of 4236. The upward divergence of moving averages is a typical breakout pattern.
Geopolitical uncertainty fuels safe-haven buying
US-led peace talks between Russia and Ukraine have stalled. Ukrainian President Zelensky proposed "abandoning NATO membership" in exchange for Western security guarantees. Although this touched on Russia's core demands, the stalemate over the territorial issue has kept geopolitical risks at a high level.
US economic data: the key to success or failure in gold trading.
Gold prices may take advantage of the upcoming US data releases , with the US releasing a series of key data this week, including the non-farm payrolls report (NFP), consumer price index (CPI), retail sales data, and unemployment rate report. Each of these data points could trigger significant fluctuations in gold prices and become a key basis for trading decisions.
Non-farm payrolls report: The interplay between employment momentum and expectations of interest rate cuts
As one of the most closely watched economic indicators, the non-farm payroll report was delayed by 11 days due to the US government shutdown, adding extra market attention and volatility pressure. The market expected only 50,000 new jobs, far lower than last month's 119,000. If the data is released, it will signify a clear slowdown in job growth momentum. For gold trading:
If the data is weaker than expected, it will strengthen market expectations for an earlier rate cut by the Federal Reserve, weaken the attractiveness of the US dollar and US Treasury yields, drive up demand for gold as a safe haven, and the price of gold is expected to break through $4,350 and move toward historical highs.
If the data is stronger than expected, it means the labor market remains resilient, inflationary pressures may remain high, expectations for a Fed rate cut will cool, and gold prices may face downward pressure. The support level of $4,300 should be closely watched. In addition, traders should also focus on employment trends and wage growth data in key sectors such as technology and healthcare—slower wage growth will signal easing inflation, which is beneficial for gold; conversely, it may suppress gold price increases.
Retail Sales and Unemployment Rate: Signs of Consumer Resilience and Economic Slowdown
The upcoming core retail sales report is expected to show a growth rate of 0.2%. If the data falls short of expectations, it will indicate a slowdown in household spending growth, forcing businesses to adopt prudent strategies and reinforcing expectations that the Federal Reserve will cut interest rates to support the economy, thus providing support for gold. Conversely, strong consumer resilience may weaken expectations of further easing, putting downward pressure on gold prices.
Unemployment rate data is also crucial.
The market expects the unemployment rate to rise slightly from 4.4% to 4.5%, a subtle change that suggests the labor market may be entering an easing cycle. For gold trading, rising unemployment will increase the probability of the Federal Reserve cutting interest rates earlier than expected, pushing down bond yields and benefiting demand for gold. However, structural impacts should be noted—pressure on consumer-driven sectors may indirectly transmit to risk asset sentiment, and significant stock market volatility could trigger a short-term sell-off in gold.
CPI data: The final "test" of inflation stickiness.
Thursday's Consumer Price Index (CPI) release will directly test inflation stickiness. If inflation data falls, it will open up room for the Federal Reserve to further cut interest rates, increasing the attractiveness of gold as an inflation hedge; if inflation remains above the policy target, it may limit the extent of rate cuts, and the upward pace of gold prices may slow.
Summary and Technical Analysis:
Gold had previously hesitated to rise, waiting for the 5, 10, 20, and 30-day moving averages to complete their adjustment before breaking through. At the same time, due to sufficient consolidation below the important level of 4236, the breakout was smooth. The pullback in gold prices last Friday indicates that the price had completed a one-day pullback after the breakout, which also shows that the major players in the gold market are in a tight timeframe and have an urgent task to complete the rise before the Fed's interest rate cut and the important non-farm payroll data release.
Meanwhile, the MACD indicator suggests a risk of divergence if gold prices reach new highs. Coupled with the hesitant rise and nimble pullbacks in gold's recent upward movement, this breakout remains highly questionable.
The recent two-day rise in gold prices is likely a reaction to the data. Once the non-farm payroll data is released, prices will begin to fall back. The price action will likely see a rapid breakout towards new highs, followed by a pullback and consolidation due to divergence, or it may not break through to new highs but instead slowly rise along the upward trend while waiting for the MACD to correct. We can wait and see.
Support levels are at the middle and lower rails of the channel, as well as the 5-day moving average. Resistance levels are at 4353 and 4381, which are also the upper rails of the channel.
(Spot gold daily chart, source: FX678)
At 21:38 Beijing time, spot gold was trading at $4,340 per ounce.
- Risk Warning and Disclaimer
- The market involves risk, and trading may not be suitable for all investors. This article is for reference only and does not constitute personal investment advice, nor does it take into account certain users’ specific investment objectives, financial situation, or other needs. Any investment decisions made based on this information are at your own risk.