How will non-farm payrolls and the three major central banks define the next steps for US Treasuries, the US dollar, and gold?
2025-12-15 20:28:07
On Monday (December 15), global financial markets entered a cautious trading mode ahead of a key policy week. The US dollar index dipped slightly by 0.13% to 98.2595, the 10-year US Treasury yield fell 0.62% to 4.165%, while spot gold rose significantly by 1.02% to $4344.03. Market attention is focused on the US non-farm payroll data due on Tuesday (expected to show an increase of 35,000 in November), as well as the policy meetings of the European Central Bank, the Bank of England, and the Bank of Japan on Thursday and Friday. Although improved Eurozone industrial production data boosted risk sentiment, investors chose to reduce risk exposure ahead of multiple events, causing US Treasury yields and the dollar to fall in tandem, while gold broke through key resistance levels with the help of safe-haven inflows.

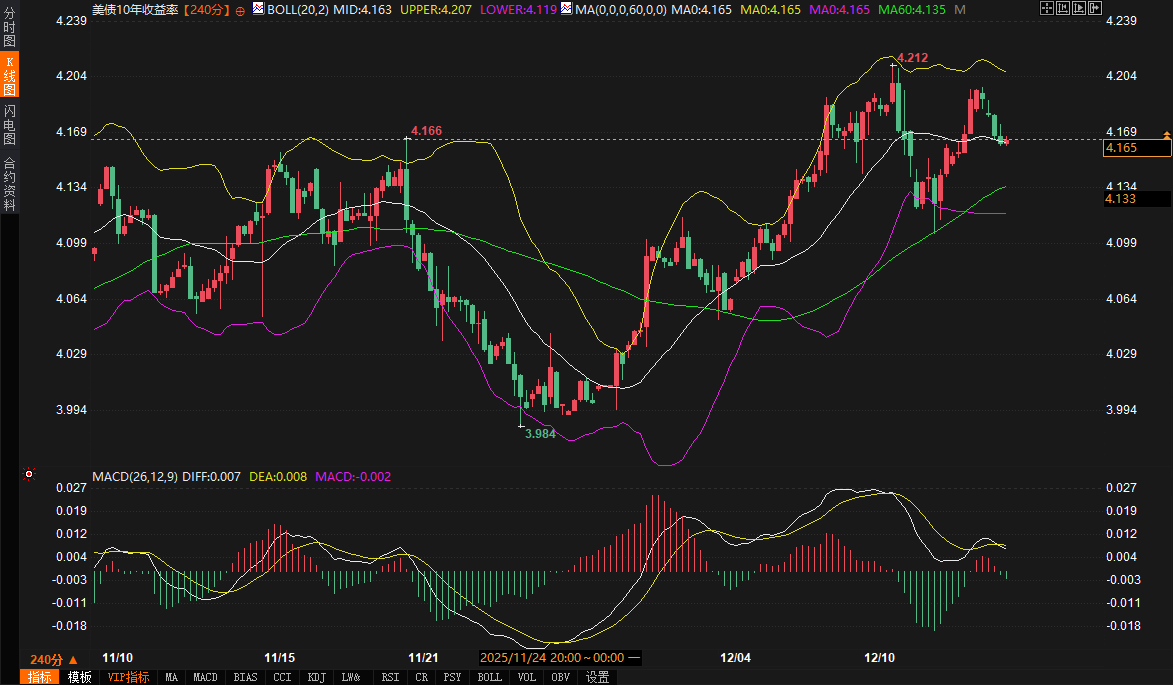
From a technical perspective, the 10-year US Treasury yield briefly broke through the upper Bollinger Band (4.207%) on the 240-minute chart before falling back, currently hovering near the middle band at 4.163%. The MACD lines are close to the zero line, indicating weakening short-term momentum. Fundamental drivers are mainly twofold: first, some investors closed out long positions previously held based on expectations of a hawkish rate cut by the Federal Reserve before the release of the non-farm payroll data; second, the pressure from long-term bond supply continues to intensify. According to institutional data, Germany plans to expand its government bond issuance to approximately €350 billion next year, coupled with the potential reduction in demand for ultra-long-term bonds due to Dutch pension fund reforms, pushing the global long-term yield center upward. Although the 10-year US Treasury yield is currently under technical pressure, if the employment data exceeds expectations, it may retest the 4.20% level.
Analysts point out that there is disagreement in the market regarding the Federal Reserve's policy path. Some clients believe that the upward revision of the 2026 economic growth forecast in the dot plot suggests that interest rates may remain high for a longer period, while other institutions emphasize the need to wait for employment and inflation data to confirm this. This uncertainty has led to a "wait-and-see" mode in the short-term US Treasury market, with the spread between 2-year and 10-year yields fluctuating narrowly in the 64-66 basis point range, reflecting the market's indecisive state before a directional decision is made.
The US dollar index is currently under pressure below the Bollinger Band middle line at 98.51, and the MACD remains below the zero line, indicating a weak short-term trend. The core reason for the dollar's weakness is that the pullback in US Treasury yields has eroded its interest rate advantage. It's worth noting that Eurozone bond yields have also declined (the German 10-year yield fell to 2.84%), but the euro has still strengthened slightly against the dollar to 1.1748, reflecting market expectations that the European Central Bank may release a "hawkish and stable" signal. Analysts believe that if the ECB raises its growth outlook and emphasizes its 2% inflation target in its new economic forecast, it could further boost the euro's rebound, putting passive pressure on the dollar.
Furthermore, the former US president's tariff remarks have reignited market concerns about the trade environment, further weakening the dollar's safe-haven appeal. In the short term, the dollar index finds support at the lower Bollinger Band at 97.97; a break below this level could open up further downside potential. Resistance lies at 99.06 (the upper Bollinger Band) to reverse the downward trend. Close attention should be paid to the interplay between US Treasury yields and Eurozone policy signals during trading.

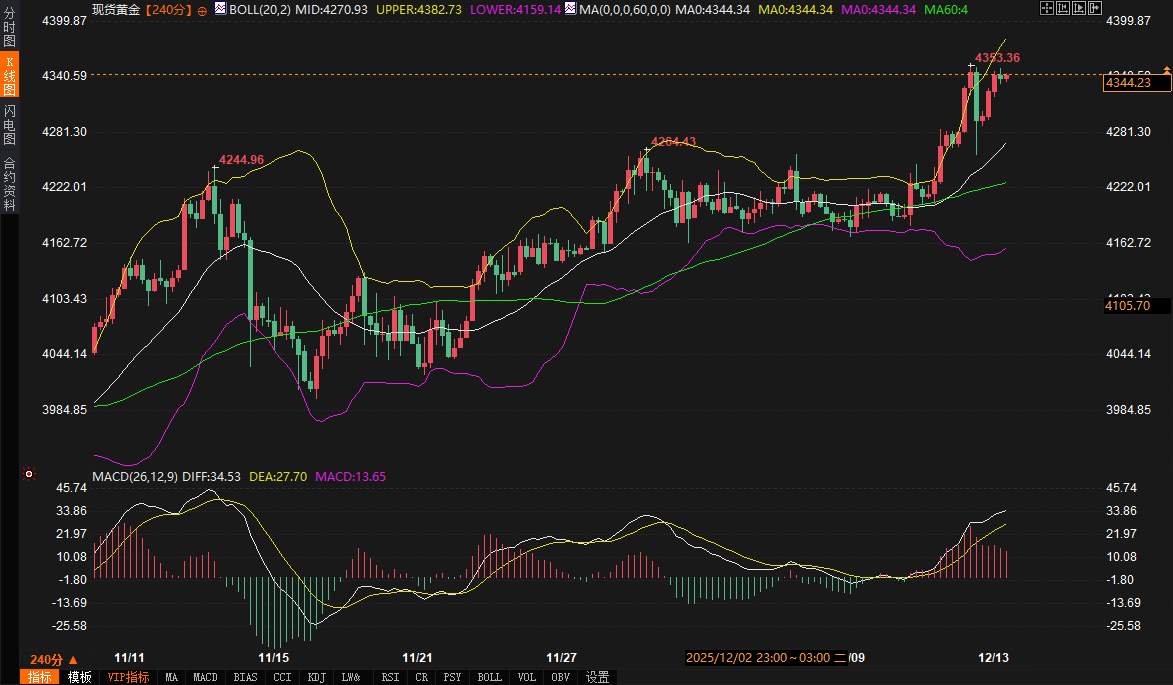
Spot gold broke strongly above the upper Bollinger Band ($4382.66) on the 240-minute chart, with the MACD histogram expanding, indicating strong buying momentum. This rally is not solely driven by a weakening dollar, but also reflects the safe-haven demand arising from increased volatility in the bond market. On one hand, the upward shift in the long-term yield curve of US Treasury bonds (the 30-year yield rose to around 4.83%) has exacerbated market concerns about tightening financing conditions; on the other hand, geopolitical risks (such as the Russia-Ukraine situation) and policy uncertainties have prompted some funds to turn to gold for hedging.
From a technical perspective, gold's short-term support lies at the Bollinger Band middle line around $4270, which is also the upper edge of the previous trading range. If gold prices can hold above $4350, they may test the psychological level of $4400. It's worth noting that if Tuesday's non-farm payroll data is significantly stronger than expected, it could exert downward pressure on gold by boosting US Treasury yields and the US dollar. However, looking at fund flows, some hedge funds have recently increased their allocation to commodities, and gold, as a traditional safe-haven asset, continues to receive structural buying support.
The market will see intense competition surrounding the US non-farm payroll data in the next 48 hours. If job growth significantly exceeds the expected 35,000, it could strengthen the Federal Reserve's assessment of economic resilience, driving a rebound in US Treasury yields and the dollar, while gold faces downward pressure. Conversely, if the data is weak, rising market expectations for interest rate cuts could further suppress the dollar, and gold is likely to continue its upward trend.
In the medium to long term, the policy statements of the European Central Bank and the Bank of England will influence the global interest rate expectation gap, thereby affecting the price movements of the US dollar and gold. Key technical ranges are as follows:
10-year US Treasury yield : Support at 4.12% (lower Bollinger Band), resistance at 4.21% (previous high and upper Bollinger Band).
US Dollar Index : Support at 97.97 (lower Bollinger Band), Resistance at 99.06 (upper Bollinger Band)
Spot gold : Support at $4270 (Bollinger Band middle line), resistance at $4400 (psychological level and upper channel line).
Overall, the market is poised for action ahead of major data releases and events, closely monitoring changes in the bond yield curve and the transmission of central bank policy signals.
The rationale behind the pullback in US Treasury yields: pre-data position adjustments and long-term supply pressures.
From a technical perspective, the 10-year US Treasury yield briefly broke through the upper Bollinger Band (4.207%) on the 240-minute chart before falling back, currently hovering near the middle band at 4.163%. The MACD lines are close to the zero line, indicating weakening short-term momentum. Fundamental drivers are mainly twofold: first, some investors closed out long positions previously held based on expectations of a hawkish rate cut by the Federal Reserve before the release of the non-farm payroll data; second, the pressure from long-term bond supply continues to intensify. According to institutional data, Germany plans to expand its government bond issuance to approximately €350 billion next year, coupled with the potential reduction in demand for ultra-long-term bonds due to Dutch pension fund reforms, pushing the global long-term yield center upward. Although the 10-year US Treasury yield is currently under technical pressure, if the employment data exceeds expectations, it may retest the 4.20% level.
Analysts point out that there is disagreement in the market regarding the Federal Reserve's policy path. Some clients believe that the upward revision of the 2026 economic growth forecast in the dot plot suggests that interest rates may remain high for a longer period, while other institutions emphasize the need to wait for employment and inflation data to confirm this. This uncertainty has led to a "wait-and-see" mode in the short-term US Treasury market, with the spread between 2-year and 10-year yields fluctuating narrowly in the 64-66 basis point range, reflecting the market's indecisive state before a directional decision is made.
US Dollar Index: Under pressure from both retreating US Treasury yields and monetary policy.
The US dollar index is currently under pressure below the Bollinger Band middle line at 98.51, and the MACD remains below the zero line, indicating a weak short-term trend. The core reason for the dollar's weakness is that the pullback in US Treasury yields has eroded its interest rate advantage. It's worth noting that Eurozone bond yields have also declined (the German 10-year yield fell to 2.84%), but the euro has still strengthened slightly against the dollar to 1.1748, reflecting market expectations that the European Central Bank may release a "hawkish and stable" signal. Analysts believe that if the ECB raises its growth outlook and emphasizes its 2% inflation target in its new economic forecast, it could further boost the euro's rebound, putting passive pressure on the dollar.
Furthermore, the former US president's tariff remarks have reignited market concerns about the trade environment, further weakening the dollar's safe-haven appeal. In the short term, the dollar index finds support at the lower Bollinger Band at 97.97; a break below this level could open up further downside potential. Resistance lies at 99.06 (the upper Bollinger Band) to reverse the downward trend. Close attention should be paid to the interplay between US Treasury yields and Eurozone policy signals during trading.
The safe-haven logic of gold: the resonance between bond market volatility and capital inflows
Spot gold broke strongly above the upper Bollinger Band ($4382.66) on the 240-minute chart, with the MACD histogram expanding, indicating strong buying momentum. This rally is not solely driven by a weakening dollar, but also reflects the safe-haven demand arising from increased volatility in the bond market. On one hand, the upward shift in the long-term yield curve of US Treasury bonds (the 30-year yield rose to around 4.83%) has exacerbated market concerns about tightening financing conditions; on the other hand, geopolitical risks (such as the Russia-Ukraine situation) and policy uncertainties have prompted some funds to turn to gold for hedging.
From a technical perspective, gold's short-term support lies at the Bollinger Band middle line around $4270, which is also the upper edge of the previous trading range. If gold prices can hold above $4350, they may test the psychological level of $4400. It's worth noting that if Tuesday's non-farm payroll data is significantly stronger than expected, it could exert downward pressure on gold by boosting US Treasury yields and the US dollar. However, looking at fund flows, some hedge funds have recently increased their allocation to commodities, and gold, as a traditional safe-haven asset, continues to receive structural buying support.
Outlook for the next 2-3 days: The interplay between data-driven decisions and policy signals
The market will see intense competition surrounding the US non-farm payroll data in the next 48 hours. If job growth significantly exceeds the expected 35,000, it could strengthen the Federal Reserve's assessment of economic resilience, driving a rebound in US Treasury yields and the dollar, while gold faces downward pressure. Conversely, if the data is weak, rising market expectations for interest rate cuts could further suppress the dollar, and gold is likely to continue its upward trend.
In the medium to long term, the policy statements of the European Central Bank and the Bank of England will influence the global interest rate expectation gap, thereby affecting the price movements of the US dollar and gold. Key technical ranges are as follows:
10-year US Treasury yield : Support at 4.12% (lower Bollinger Band), resistance at 4.21% (previous high and upper Bollinger Band).
US Dollar Index : Support at 97.97 (lower Bollinger Band), Resistance at 99.06 (upper Bollinger Band)
Spot gold : Support at $4270 (Bollinger Band middle line), resistance at $4400 (psychological level and upper channel line).
Overall, the market is poised for action ahead of major data releases and events, closely monitoring changes in the bond yield curve and the transmission of central bank policy signals.
- Risk Warning and Disclaimer
- The market involves risk, and trading may not be suitable for all investors. This article is for reference only and does not constitute personal investment advice, nor does it take into account certain users’ specific investment objectives, financial situation, or other needs. Any investment decisions made based on this information are at your own risk.