Crude oil outlook: The US dollar's rare synchronized decline reveals an overlooked truth.
2025-12-15 20:33:13
Although the two institutions have slight differences in their predictions on market balance, they both point to a clear signal: the era of "continuous surge" in crude oil supply has ended, and structural adjustments in the supply and demand pattern are providing a new logical framework for trading.
Meanwhile, the recent weakening of both the US dollar index and crude oil prices may indicate the current state of weak crude oil demand. This article provides a brief explanation of the factors affecting oil prices, and reveals an important detail about oil price movements at the end of the article.

For the first time since May, the IEA has lowered its forecast for a global oil supply glut, stating that "the continued surge in global oil supply has come to an abrupt end."
This assessment is driven by the combined effect of multiple supply contraction factors: global crude oil supply in November decreased by 1.5 million barrels per day compared to two months prior, with OPEC+ contributing 80% of the decline. This was mainly due to escalating US restrictions on Russia and Venezuela, unplanned production shutdowns in Kuwait and Kazakhstan, and transportation disruptions following the attack on the Novorossiysk port in Kazakhstan.
Supply adjustments in non-OPEC countries are equally crucial.
Brazil's production is declining due to the shutdown of offshore platforms, while the US shale oil industry is facing profit pressure. The US federal government predicts that the average price of West Texas Intermediate (WTI) crude oil will fall to $51.42 per barrel in 2026, below the break-even point for most shale oil producers. This will lead to a 1% decrease in total US crude oil production to 13.53 million barrels per day, with the decline occurring entirely in the shale basins of the 48 contiguous states.
OPEC further elaborated on the long-term supply-side logic: non-OPEC liquid fuel production will increase by 1 million barrels per day in 2025, mainly from the United States, Brazil, Canada and Argentina, but this growth will slow to 600,000 barrels per day in 2026. The slowdown in the pace of capacity expansion will further alleviate supply-side pressure.
However, it is worth noting that the IEA emphasizes that global crude oil supply will still increase by 2.4 million barrels per day in 2026, and the oversupply situation has not been completely reversed, which constitutes the core constraint on the rise of oil prices.
On the demand side, the two institutions reached a consensus that global oil demand will continue to grow steadily, becoming a key force supporting the oil market.
OPEC slightly revised its 2025 global economic growth forecast upward to 3.1% and kept its 2026 forecast unchanged, citing easing trade tensions, expansionary fiscal policies in major economies, and strong performance in core emerging markets such as India and China as the driving force for growth.
Specifically, global oil demand growth is projected to reach 1.3 million barrels per day in 2025, with non-OECD economies contributing the vast majority of the increase; demand growth is expected to accelerate further to 1.4 million barrels per day in 2026, driven primarily by continued economic activity in Asia, the Middle East, and Latin America.
Data from the IEA shows that global crude oil demand is expected to increase by 860,000 barrels per day in 2026 compared to 2025, an increase of nearly 4%. Although the growth rate is lower than OPEC's expectations, it still highlights the resilience of demand.
It is worth noting that changes in demand structure are creating structural trading opportunities.
The recovery in refinery demand is particularly evident. Refinery profits improved across all regions of the world in November, primarily due to increased refinery utilization rates and consistently lower-than-historical refined product inventories. This trend will directly drive immediate crude oil demand.
Inventory data provided important support for the short-term oil market. The IEA pointed out that October was the peak month for global crude oil inventories. The average daily inventory increased by 1.2 million barrels in the first 10 months. However, OECD commercial crude oil inventories decreased by 32 million barrels in October. Although still higher than the same period last year, they are significantly lower than the average level of the past five years.
OPEC further emphasized that the continued depletion of inventories fully confirms that the oil market will remain tight in early 2026.
The futures market structure also reflects the tight physical supply. Brent and Oman crude oil futures have maintained a backwardation pattern for a long time. This signal is of great significance to traders. The strong resilience of the spot market may buffer the selling pressure in the futures market, and the downside potential of oil prices is limited in the short term.
However, we need to be wary of the potential inventory pressure brought by crude oil en route.
Since the end of August, global crude oil shipments have surged by 213 million barrels, mainly due to the difficulty in finding buyers for crude oil from restricted countries, record long-haul shipments from the Americas to Asia, and increased exports from OPEC+ members in the Middle East. This hidden inventory may be gradually released in the future, putting downward pressure on oil prices.
The core contradiction in the current oil market lies in the interplay between "short-term supply contraction" and "long-term oversupply pressure." The disagreement between the IEA and OPEC provides a boundary for shifting between bullish and bearish positions. Traders need to focus on three key areas:
Key variables on the supply side
The strength of OPEC+'s production cuts, the actual changes in US shale oil production (which requires tracking the number of drilling rigs and well completion data), and geopolitical risks (Russia and Venezuela limiting progress, the situation in the Middle East) will directly determine the direction of short-term oil price fluctuations.
Demand-side validation metrics
Data on crude oil imports in emerging markets such as India, refined product consumption data in OECD countries, and changes in refinery operating rates and profits could reverse long-term oversupply expectations if demand growth exceeds expectations.
Market structure signals
The term structure of Brent crude oil futures (whether the spot premium continues), marginal changes in OECD inventories and crude oil in transit, and these data are the core basis for judging the shift in bullish and bearish logic.
Overall, the crude oil market in 2026 will be characterized by "narrow fluctuations and structural differentiation," with WTI and Brent crude oil likely to trade in the range of $55-70 per barrel.
Traders need to abandon one-sided thinking, focus on marginal changes in supply and demand, take advantage of the divergence in expectations between the two major institutions to capture short-term trading opportunities, and be wary of downside risks brought about by inventory accumulation and demand falling short of expectations.
I also made another discovery: the relationship between the US dollar index and crude oil prices. Usually, the US dollar index and oil prices are negatively correlated because the US dollar is the unit of account for crude oil prices. However, there are times when the US dollar and oil prices are positively correlated.
It can be observed that the US dollar and crude oil sometimes rise in the same direction, which may indicate that the market demand for crude oil is strong or the supply is insufficient, and even higher prices are tolerable. Similarly, when the US dollar index and oil prices fall at the same time, it means that the market demand for crude oil is weak or the supply is excessive, and even if the price falls, it cannot boost the demand for crude oil.
The long-term downward trend in oil prices and the US dollar may indirectly indicate that the market believes there is an overall oversupply of crude oil. This change occurred in 2015, when crude oil and the US dollar tended to move in the same direction, indicating that the supply and demand mismatch in the crude oil market became more severe at this point, and also representing more trading opportunities.
(US dollar index combined with continuous US crude oil futures contract, source: FX678)
At 20:27 Beijing time, the US dollar index was quoted at 57.09.
Meanwhile, the recent weakening of both the US dollar index and crude oil prices may indicate the current state of weak crude oil demand. This article provides a brief explanation of the factors affecting oil prices, and reveals an important detail about oil price movements at the end of the article.
Supply side: Contraction signals are clear, and excess pressure will persist in 2026.
For the first time since May, the IEA has lowered its forecast for a global oil supply glut, stating that "the continued surge in global oil supply has come to an abrupt end."
This assessment is driven by the combined effect of multiple supply contraction factors: global crude oil supply in November decreased by 1.5 million barrels per day compared to two months prior, with OPEC+ contributing 80% of the decline. This was mainly due to escalating US restrictions on Russia and Venezuela, unplanned production shutdowns in Kuwait and Kazakhstan, and transportation disruptions following the attack on the Novorossiysk port in Kazakhstan.
Supply adjustments in non-OPEC countries are equally crucial.
Brazil's production is declining due to the shutdown of offshore platforms, while the US shale oil industry is facing profit pressure. The US federal government predicts that the average price of West Texas Intermediate (WTI) crude oil will fall to $51.42 per barrel in 2026, below the break-even point for most shale oil producers. This will lead to a 1% decrease in total US crude oil production to 13.53 million barrels per day, with the decline occurring entirely in the shale basins of the 48 contiguous states.
OPEC further elaborated on the long-term supply-side logic: non-OPEC liquid fuel production will increase by 1 million barrels per day in 2025, mainly from the United States, Brazil, Canada and Argentina, but this growth will slow to 600,000 barrels per day in 2026. The slowdown in the pace of capacity expansion will further alleviate supply-side pressure.
However, it is worth noting that the IEA emphasizes that global crude oil supply will still increase by 2.4 million barrels per day in 2026, and the oversupply situation has not been completely reversed, which constitutes the core constraint on the rise of oil prices.
Demand side: Resilience continues to be demonstrated, with emerging markets leading the growth.
On the demand side, the two institutions reached a consensus that global oil demand will continue to grow steadily, becoming a key force supporting the oil market.
OPEC slightly revised its 2025 global economic growth forecast upward to 3.1% and kept its 2026 forecast unchanged, citing easing trade tensions, expansionary fiscal policies in major economies, and strong performance in core emerging markets such as India and China as the driving force for growth.
Specifically, global oil demand growth is projected to reach 1.3 million barrels per day in 2025, with non-OECD economies contributing the vast majority of the increase; demand growth is expected to accelerate further to 1.4 million barrels per day in 2026, driven primarily by continued economic activity in Asia, the Middle East, and Latin America.
Data from the IEA shows that global crude oil demand is expected to increase by 860,000 barrels per day in 2026 compared to 2025, an increase of nearly 4%. Although the growth rate is lower than OPEC's expectations, it still highlights the resilience of demand.
It is worth noting that changes in demand structure are creating structural trading opportunities.
The recovery in refinery demand is particularly evident. Refinery profits improved across all regions of the world in November, primarily due to increased refinery utilization rates and consistently lower-than-historical refined product inventories. This trend will directly drive immediate crude oil demand.
Inventory and Market Structure: Strong Short-Term Support, Hidden Risks from Hidden Inventories
Inventory data provided important support for the short-term oil market. The IEA pointed out that October was the peak month for global crude oil inventories. The average daily inventory increased by 1.2 million barrels in the first 10 months. However, OECD commercial crude oil inventories decreased by 32 million barrels in October. Although still higher than the same period last year, they are significantly lower than the average level of the past five years.
OPEC further emphasized that the continued depletion of inventories fully confirms that the oil market will remain tight in early 2026.
The futures market structure also reflects the tight physical supply. Brent and Oman crude oil futures have maintained a backwardation pattern for a long time. This signal is of great significance to traders. The strong resilience of the spot market may buffer the selling pressure in the futures market, and the downside potential of oil prices is limited in the short term.
However, we need to be wary of the potential inventory pressure brought by crude oil en route.
Since the end of August, global crude oil shipments have surged by 213 million barrels, mainly due to the difficulty in finding buyers for crude oil from restricted countries, record long-haul shipments from the Americas to Asia, and increased exports from OPEC+ members in the Middle East. This hidden inventory may be gradually released in the future, putting downward pressure on oil prices.
Core of Trading: Seizing Opportunities in the Long-Short Game from Three Dimensions
The core contradiction in the current oil market lies in the interplay between "short-term supply contraction" and "long-term oversupply pressure." The disagreement between the IEA and OPEC provides a boundary for shifting between bullish and bearish positions. Traders need to focus on three key areas:
Key variables on the supply side
The strength of OPEC+'s production cuts, the actual changes in US shale oil production (which requires tracking the number of drilling rigs and well completion data), and geopolitical risks (Russia and Venezuela limiting progress, the situation in the Middle East) will directly determine the direction of short-term oil price fluctuations.
Demand-side validation metrics
Data on crude oil imports in emerging markets such as India, refined product consumption data in OECD countries, and changes in refinery operating rates and profits could reverse long-term oversupply expectations if demand growth exceeds expectations.
Market structure signals
The term structure of Brent crude oil futures (whether the spot premium continues), marginal changes in OECD inventories and crude oil in transit, and these data are the core basis for judging the shift in bullish and bearish logic.
Summary: The oil market in 2026 is expected to be volatile, with a focus on marginal changes.
Overall, the crude oil market in 2026 will be characterized by "narrow fluctuations and structural differentiation," with WTI and Brent crude oil likely to trade in the range of $55-70 per barrel.
Traders need to abandon one-sided thinking, focus on marginal changes in supply and demand, take advantage of the divergence in expectations between the two major institutions to capture short-term trading opportunities, and be wary of downside risks brought about by inventory accumulation and demand falling short of expectations.
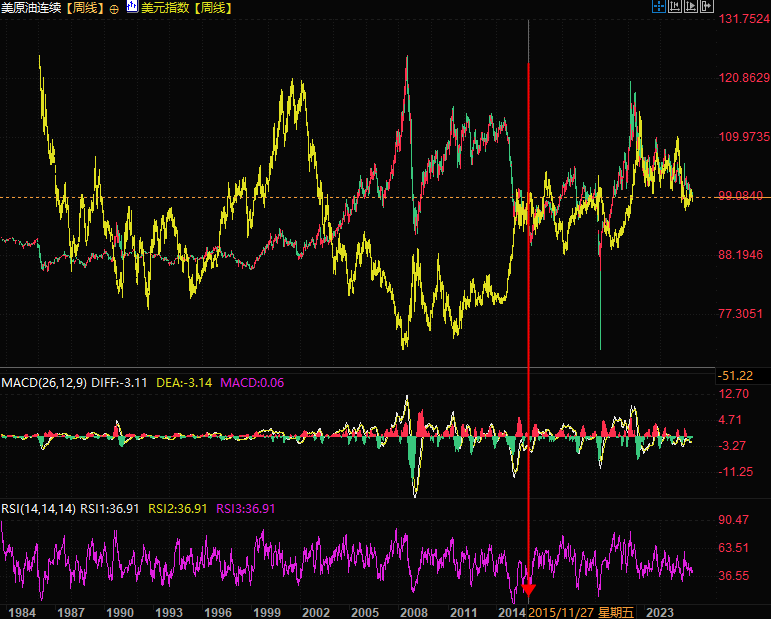
I also made another discovery: the relationship between the US dollar index and crude oil prices. Usually, the US dollar index and oil prices are negatively correlated because the US dollar is the unit of account for crude oil prices. However, there are times when the US dollar and oil prices are positively correlated.
It can be observed that the US dollar and crude oil sometimes rise in the same direction, which may indicate that the market demand for crude oil is strong or the supply is insufficient, and even higher prices are tolerable. Similarly, when the US dollar index and oil prices fall at the same time, it means that the market demand for crude oil is weak or the supply is excessive, and even if the price falls, it cannot boost the demand for crude oil.
The long-term downward trend in oil prices and the US dollar may indirectly indicate that the market believes there is an overall oversupply of crude oil. This change occurred in 2015, when crude oil and the US dollar tended to move in the same direction, indicating that the supply and demand mismatch in the crude oil market became more severe at this point, and also representing more trading opportunities.
(US dollar index combined with continuous US crude oil futures contract, source: FX678)
At 20:27 Beijing time, the US dollar index was quoted at 57.09.
- Risk Warning and Disclaimer
- The market involves risk, and trading may not be suitable for all investors. This article is for reference only and does not constitute personal investment advice, nor does it take into account certain users’ specific investment objectives, financial situation, or other needs. Any investment decisions made based on this information are at your own risk.