$60 Can't Be Held: How Did Oil Floating at Sea Drive Down Prices on Land?
2025-12-16 20:26:29
On Tuesday (December 16), Brent crude oil continued its nearly two-week downward trend, breaking below the $60 mark and hitting a new low of $59.41 during the session, with a pre-market price of $59.63. Prices fell to near seven-month lows, while US crude oil futures also retreated into their weak range since February 2021, indicating that this selling pressure was not a localized sentiment but rather a synchronized downward correction in the pricing of the entire crude oil market.

The core driver of this round of decline is the market's repricing of rising expectations for peace between Russia and Ukraine, and the resulting association with the easing of sanctions. The logic is clear: once restrictive measures are marginally relaxed, Russian crude oil that was previously stuck at sea or required a higher discount to be sold will theoretically find buyers more easily; at the same time, the reduced risk of disruption to energy infrastructure will also compress the geopolitical premium previously paid by the market. More importantly, "expectations" themselves often take effect before "increased supply," with macro funds and algorithmic models adjusting their exposure in the direction of supply easing first, forming trend-based selling pressure. In the narrative-driven phase, prices are significantly more sensitive to news than to slower variables such as inventory and refinery operating rates.
However, it's crucial to separate the emotional impact from the verifiable increase in supply. Even as restrictions gradually ease, Russia's new supply faces two hard constraints: firstly, production is constrained by OPEC and its allies' established targets, and excessive production increases will raise frictional costs at the quota level; secondly, production capacity is nearing its limit, making a significant increase in actual exports in the short term difficult. Meanwhile, the so-called "easier trading of maritime inventory" often resembles a redistribution of flows and settlement channels, rather than a substantial increase in global daily supply. In other words, this downturn is more like a "rapid clearing of risk and expectation premiums" than a structural deterioration in the supply and demand balance overnight. For traders, a common side effect of such declines is a stronger bias towards discounts in the term structure, increased volatility in inter-month spreads, and price discovery becoming more driven by sentiment than inventory details.
Looking at the daily candlestick chart, after falling from the previous high of $65.27, the price initially fluctuated between $62.50 and $63.50 before breaking below the previous low of $61.51, with the bears pushing the price below $60. The recent series of bearish candlesticks exhibits a downward trend with lower highs and lower lows, indicating significant resistance from the trendline. Meanwhile, after touching the lower shadow at $59.41, the price has currently returned to $59.63, suggesting some support around the $60 psychological level. However, this appears more like a technical pause than a trend reversal.
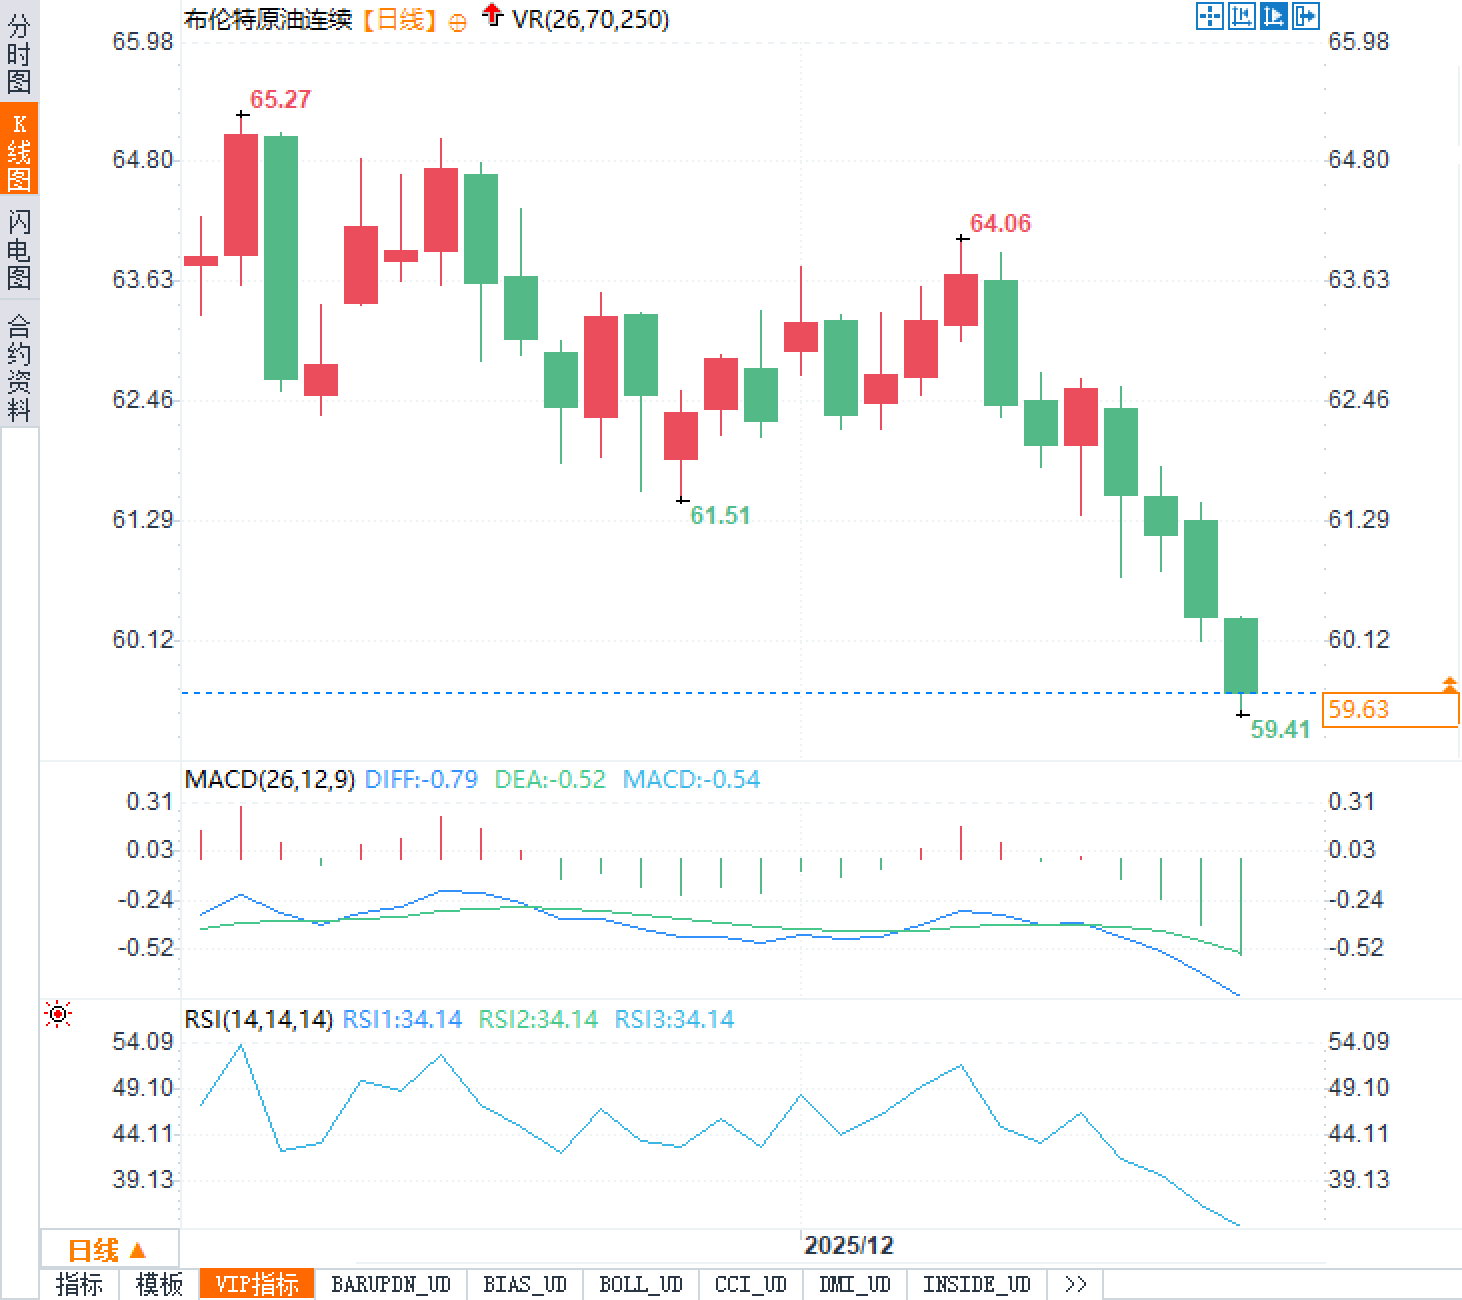
In terms of momentum indicators, the MACD shows DIFF at -0.79, DEA at -0.52, and the MACD histogram at -0.54, all three below the zero line and with weak histogram bars, indicating that downward momentum is still dominant. The RSI is 34.14, close to the oversold threshold but not yet extreme, typically implying a short-term technical rebound window, but the rebound is more likely to be blocked at the resistance zone. Structurally, three price bands are worth noting: the first support is at $59.41; if it breaks down effectively, the market is likely to experience a "stop-loss chain" leading to an accelerated wave; the first resistance levels above are $60 and $61.30; only if these can be recovered and held can the price be pulled back to the previous consolidation zone of $62.50. Further up, $63.50 represents the previous consolidation zone, often a point of contention between short covering and bullish attempts. Key resistance levels further away are around $64 and $64.80. If a rebound reaches these areas but fails to hold, it could easily turn into a second downward move, with support becoming resistance. The top at $65.27 is a reference point for the starting point of this downward move; only by regaining this range can the daily chart structure shift from a downtrend to a higher-level consolidation market.
Bullish Outlook: If the expectation of easing sanctions fails to translate into substantial increased supply in the short term, and Russia's actual exports are constrained by quotas and production capacity, the market will gradually realize that the "supply shock has been overestimated." In this scenario, a potential double bottom is more likely to form around $59.41, and the rebound potential from the RSI approaching oversold levels will be released. The price may first retrace to $60 and $61.30 before recovering towards $62.50. A stronger bullish signal would require the daily chart to recover and hold above $61.30, while the MACD shows signs of turning upwards.
Bearish Outlook: If the market continues to reinforce the narrative of "risk premium fading," and algorithmic funds trigger more aggressive trend-following below $60, then a decisive break below $59.41 could easily lead to an accelerated decline in the short term. Increased volatility will force some funds to passively deleverage, creating a typical tailwind market. Within this framework, $60 and $61.30 will become key resistance levels for any rebound. If multiple tests fail to break through these levels, the bearish structure will be further solidified. In the medium term, only when the price returns above $62.50 and turns this area into support will the bearish trend truly loosen; otherwise, the market will still view any rebound as a "dead cat bounce" type of position adjustment.
Fundamentals:
The core driver of this round of decline is the market's repricing of rising expectations for peace between Russia and Ukraine, and the resulting association with the easing of sanctions. The logic is clear: once restrictive measures are marginally relaxed, Russian crude oil that was previously stuck at sea or required a higher discount to be sold will theoretically find buyers more easily; at the same time, the reduced risk of disruption to energy infrastructure will also compress the geopolitical premium previously paid by the market. More importantly, "expectations" themselves often take effect before "increased supply," with macro funds and algorithmic models adjusting their exposure in the direction of supply easing first, forming trend-based selling pressure. In the narrative-driven phase, prices are significantly more sensitive to news than to slower variables such as inventory and refinery operating rates.
However, it's crucial to separate the emotional impact from the verifiable increase in supply. Even as restrictions gradually ease, Russia's new supply faces two hard constraints: firstly, production is constrained by OPEC and its allies' established targets, and excessive production increases will raise frictional costs at the quota level; secondly, production capacity is nearing its limit, making a significant increase in actual exports in the short term difficult. Meanwhile, the so-called "easier trading of maritime inventory" often resembles a redistribution of flows and settlement channels, rather than a substantial increase in global daily supply. In other words, this downturn is more like a "rapid clearing of risk and expectation premiums" than a structural deterioration in the supply and demand balance overnight. For traders, a common side effect of such declines is a stronger bias towards discounts in the term structure, increased volatility in inter-month spreads, and price discovery becoming more driven by sentiment than inventory details.
Technical aspects:
Looking at the daily candlestick chart, after falling from the previous high of $65.27, the price initially fluctuated between $62.50 and $63.50 before breaking below the previous low of $61.51, with the bears pushing the price below $60. The recent series of bearish candlesticks exhibits a downward trend with lower highs and lower lows, indicating significant resistance from the trendline. Meanwhile, after touching the lower shadow at $59.41, the price has currently returned to $59.63, suggesting some support around the $60 psychological level. However, this appears more like a technical pause than a trend reversal.
In terms of momentum indicators, the MACD shows DIFF at -0.79, DEA at -0.52, and the MACD histogram at -0.54, all three below the zero line and with weak histogram bars, indicating that downward momentum is still dominant. The RSI is 34.14, close to the oversold threshold but not yet extreme, typically implying a short-term technical rebound window, but the rebound is more likely to be blocked at the resistance zone. Structurally, three price bands are worth noting: the first support is at $59.41; if it breaks down effectively, the market is likely to experience a "stop-loss chain" leading to an accelerated wave; the first resistance levels above are $60 and $61.30; only if these can be recovered and held can the price be pulled back to the previous consolidation zone of $62.50. Further up, $63.50 represents the previous consolidation zone, often a point of contention between short covering and bullish attempts. Key resistance levels further away are around $64 and $64.80. If a rebound reaches these areas but fails to hold, it could easily turn into a second downward move, with support becoming resistance. The top at $65.27 is a reference point for the starting point of this downward move; only by regaining this range can the daily chart structure shift from a downtrend to a higher-level consolidation market.
Market Outlook:
Bullish Outlook: If the expectation of easing sanctions fails to translate into substantial increased supply in the short term, and Russia's actual exports are constrained by quotas and production capacity, the market will gradually realize that the "supply shock has been overestimated." In this scenario, a potential double bottom is more likely to form around $59.41, and the rebound potential from the RSI approaching oversold levels will be released. The price may first retrace to $60 and $61.30 before recovering towards $62.50. A stronger bullish signal would require the daily chart to recover and hold above $61.30, while the MACD shows signs of turning upwards.
Bearish Outlook: If the market continues to reinforce the narrative of "risk premium fading," and algorithmic funds trigger more aggressive trend-following below $60, then a decisive break below $59.41 could easily lead to an accelerated decline in the short term. Increased volatility will force some funds to passively deleverage, creating a typical tailwind market. Within this framework, $60 and $61.30 will become key resistance levels for any rebound. If multiple tests fail to break through these levels, the bearish structure will be further solidified. In the medium term, only when the price returns above $62.50 and turns this area into support will the bearish trend truly loosen; otherwise, the market will still view any rebound as a "dead cat bounce" type of position adjustment.
- Risk Warning and Disclaimer
- The market involves risk, and trading may not be suitable for all investors. This article is for reference only and does not constitute personal investment advice, nor does it take into account certain users’ specific investment objectives, financial situation, or other needs. Any investment decisions made based on this information are at your own risk.