Is the US dollar weaker than expected? A massive capital flight masked by the yen's collapse!
2025-12-19 09:06:30
The US dollar index appears stable on the surface, but it is actually structurally weak, with its relative strength mainly supported by the extreme depreciation of the Japanese yen. Market funds are flowing from the dollar system to precious metals and other safe-haven assets, forming a wave of "currency devaluation trading." On Friday (December 19) in early Asian trading, the US dollar index fluctuated around 98.45.
Precious metals are rallying again. Since Chairman Powell's dovish speech in Jackson Hole on August 22, silver has risen by about 75%.
Silver's rally is beginning to mirror the frenzy gold experienced months ago—meaning the rally is spreading to other precious metals like platinum and palladium. If one questions whether this is a bubble, this "contagion effect" is self-evident.
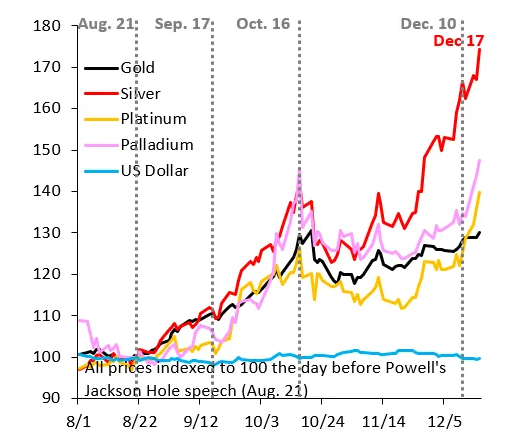
The chart above clearly illustrates the market's frenzy. The highs before the pullback in mid-October, influenced by the IMF/World Bank annual meeting, have already been surpassed for silver (red) and platinum (orange). Palladium (pink) has also just broken through its mid-October highs, and gold is similarly heading towards that level.
During this period, the trade-weighted dollar index remained stable against G10 currencies (blue), but this actually masked the apparent true strength of the dollar.
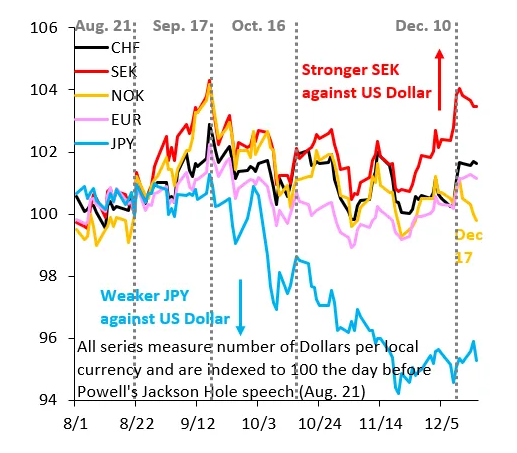
The chart above reveals the essence of the problem. The Japanese yen (blue) continued its sharp decline against the US dollar, offsetting the appreciation of other currencies such as the Swedish krona (red) and the Swiss franc (black). This means that while funds are flowing out of the US dollar and into precious metals, they are also flowing into safe-haven currencies.
This phenomenon has been masked because the yen is in a more precarious position than the dollar. All of these are typical symptoms of a "currency devaluation trade," with the rise in precious metals being just one manifestation. The market is desperately seeking any safe haven against debt monetization.
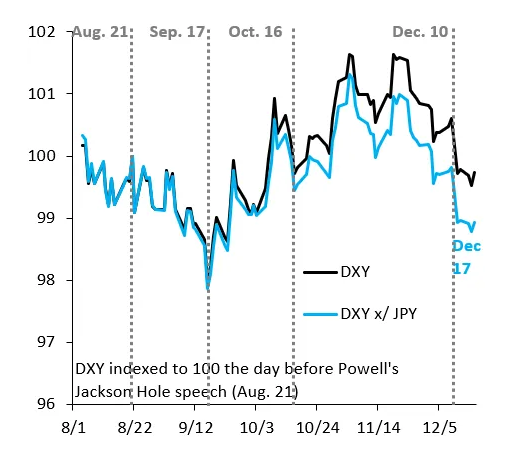
The chart above reveals the core of the issue. The black line represents the US Dollar Index, which measures the trade-weighted value of the US dollar against G10 currencies. The blue line is the US Dollar Index excluding the Japanese yen.
Currently, the two yield curves differ by only 1%, but this gap is widening as the yen continues to depreciate. It is expected that this gap will widen further against the backdrop of continued Japanese debt pressure weighing on the yen. This also means that the actual weakness of the dollar is far greater than it appears, and this problem will continue to worsen.
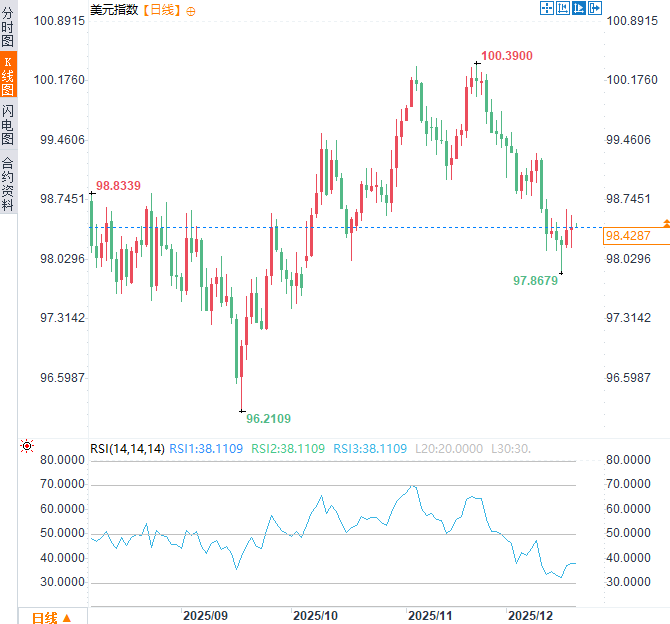
(US Dollar Index Daily Chart, Source: FX678)
The US dollar is caught in a "false strength" dilemma: the dollar index has stabilized due to the collapse of the yen, but it is actually experiencing widespread capital outflows and a crisis of confidence. The market's shift towards precious metals and non-US safe-haven assets indicates that the trading theme of "de-dollarization" or "dollar asset diversification" is deepening.
For observers, it is more important to pay attention to the US dollar index excluding the Japanese yen, as well as the trends of precious metals and safe-haven currencies, in order to understand the true pressure on the US dollar.
At 9:05 AM Beijing time, the US dollar index is currently at 98.44.
Precious metals are rallying again. Since Chairman Powell's dovish speech in Jackson Hole on August 22, silver has risen by about 75%.
Silver's rally is beginning to mirror the frenzy gold experienced months ago—meaning the rally is spreading to other precious metals like platinum and palladium. If one questions whether this is a bubble, this "contagion effect" is self-evident.
The chart above clearly illustrates the market's frenzy. The highs before the pullback in mid-October, influenced by the IMF/World Bank annual meeting, have already been surpassed for silver (red) and platinum (orange). Palladium (pink) has also just broken through its mid-October highs, and gold is similarly heading towards that level.
During this period, the trade-weighted dollar index remained stable against G10 currencies (blue), but this actually masked the apparent true strength of the dollar.
The chart above reveals the essence of the problem. The Japanese yen (blue) continued its sharp decline against the US dollar, offsetting the appreciation of other currencies such as the Swedish krona (red) and the Swiss franc (black). This means that while funds are flowing out of the US dollar and into precious metals, they are also flowing into safe-haven currencies.
This phenomenon has been masked because the yen is in a more precarious position than the dollar. All of these are typical symptoms of a "currency devaluation trade," with the rise in precious metals being just one manifestation. The market is desperately seeking any safe haven against debt monetization.
The chart above reveals the core of the issue. The black line represents the US Dollar Index, which measures the trade-weighted value of the US dollar against G10 currencies. The blue line is the US Dollar Index excluding the Japanese yen.
Currently, the two yield curves differ by only 1%, but this gap is widening as the yen continues to depreciate. It is expected that this gap will widen further against the backdrop of continued Japanese debt pressure weighing on the yen. This also means that the actual weakness of the dollar is far greater than it appears, and this problem will continue to worsen.
(US Dollar Index Daily Chart, Source: FX678)
The US dollar is caught in a "false strength" dilemma: the dollar index has stabilized due to the collapse of the yen, but it is actually experiencing widespread capital outflows and a crisis of confidence. The market's shift towards precious metals and non-US safe-haven assets indicates that the trading theme of "de-dollarization" or "dollar asset diversification" is deepening.
For observers, it is more important to pay attention to the US dollar index excluding the Japanese yen, as well as the trends of precious metals and safe-haven currencies, in order to understand the true pressure on the US dollar.
At 9:05 AM Beijing time, the US dollar index is currently at 98.44.
- Risk Warning and Disclaimer
- The market involves risk, and trading may not be suitable for all investors. This article is for reference only and does not constitute personal investment advice, nor does it take into account certain users’ specific investment objectives, financial situation, or other needs. Any investment decisions made based on this information are at your own risk.