Non-farm payrolls preview: Expected 60,000, but what's truly worth betting on is the "distortion" of this data.
2026-01-09 09:30:27
The U.S. non-farm payrolls report for December 2025 will be released at 21:30 Beijing time on Friday (January 9).
Traders and economists expect the December nonfarm payroll report to show a net increase of 60,000 jobs in the U.S.; average hourly earnings are expected to rise 0.3% month-over-month (3.6% year-over-year); and the unemployment rate is expected to decline slightly to 4.5%.
Due to the previous US government shutdown, which caused delays in fourth-quarter data releases—and in some cases, complete cancellations—economic data releases have finally returned to normal. Prior to the release of this latest round of employment market data, economists believed that the US labor market continued its trend of "low hiring, low layoffs" in December.

As shown in the chart below, traders are highly confident that the Federal Reserve will pause its rate-cutting cycle this month, and only a significant deterioration in the labor market (such as a direct decline in employment or an unemployment rate rising above 4.7%) could shake this expectation.
Therefore, the market's reaction to this data release may be relatively limited, especially considering that the U.S. Supreme Court may rule on President Trump's "emergency" tariffs about 90 minutes after the non-farm payroll data is released, which may divert some market attention.
Another reason traders may react mutedly to this data is the structural decline in the non-farm payrolls survey response rate. The chart below shows that the U.S. Bureau of Labor Statistics' survey response rate has plummeted over the past decade, indicating that the uncertainty surrounding the current employment data is far greater than in the past.
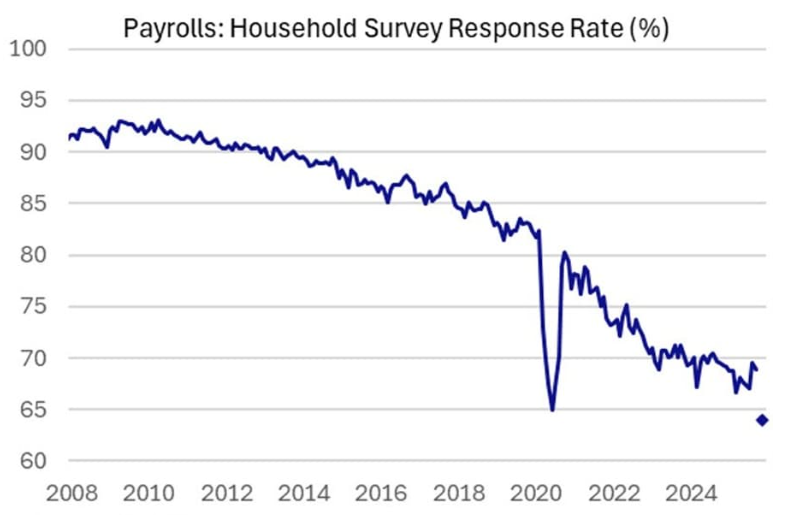
As we move into 2026 and beyond, markets should be more skeptical of all survey-based economic data and consider multiple data sources when drawing clear conclusions about the U.S. economy.
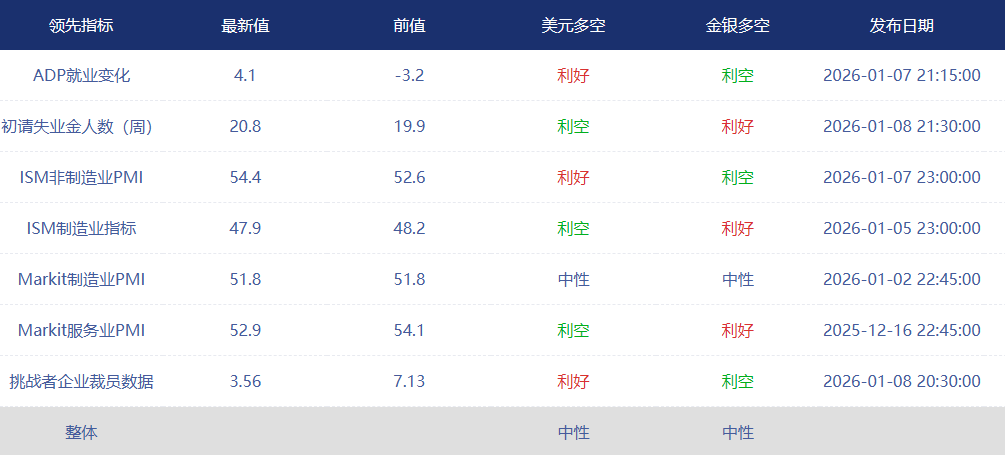
The following historically reliable leading indicators are key references for helping to predict the monthly non-farm payroll report:
(Indicator forecast chart, source:)
Leading indicators suggest that this month's nonfarm payroll report may be higher than expected. However, given the limited survey response rate, the forecast results remain highly uncertain.
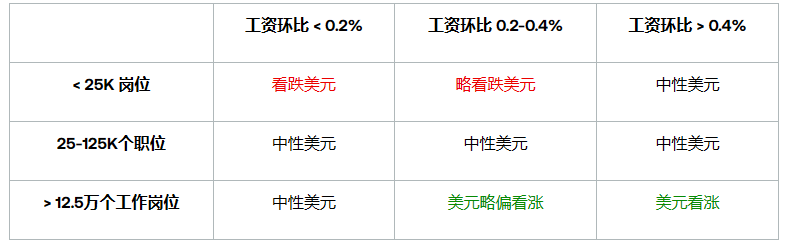
In any case, it is well known that the monthly fluctuations in this report are extremely difficult to predict, so the market should not rely too heavily on any forecast data. As always, other data in the report, including the closely watched average hourly earnings and unemployment rate, will also significantly influence the market's reaction to this report.
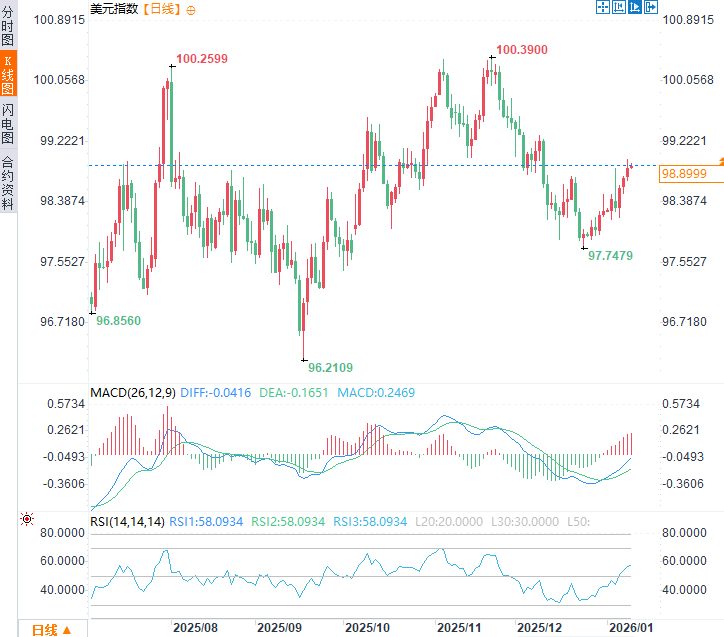
From a technical perspective, the US dollar index is near a one-month high (98.99) but is in the middle of a three-month range, which makes its risk profile more balanced before and after the data release.
(US Dollar Index Daily Chart, Source: FX678)
From a technical perspective, the AUD/USD pair is at a critical juncture ahead of the employment data release. Earlier this week, the pair touched a 15-month high of 0.6765 before forming a bearish "dark cloud cover" pattern on Wednesday, indicating a shift in intraday momentum from buying to selling. This reversal signal is corroborated by a triple bearish divergence – a top divergence between the pair and the 14-day Relative Strength Index (RSI), suggesting weakening upward momentum and reinforcing the assessment that the pair may have peaked recently.
If the jobs report does indeed exceed expectations, the Federal Reserve may not only completely abandon its plans for a January rate cut, but even the possibility of a March rate cut will be questioned, which would boost the US dollar. In this scenario, the AUD/USD pair may continue its decline, testing the mid-range of 0.6650, or even the previous resistance (now support) level of 0.6600. However, if the jobs data is strong and pushes the exchange rate back above its 78.6% Fibonacci retracement level of 0.6725, the current short-term bearish bias will be reversed.
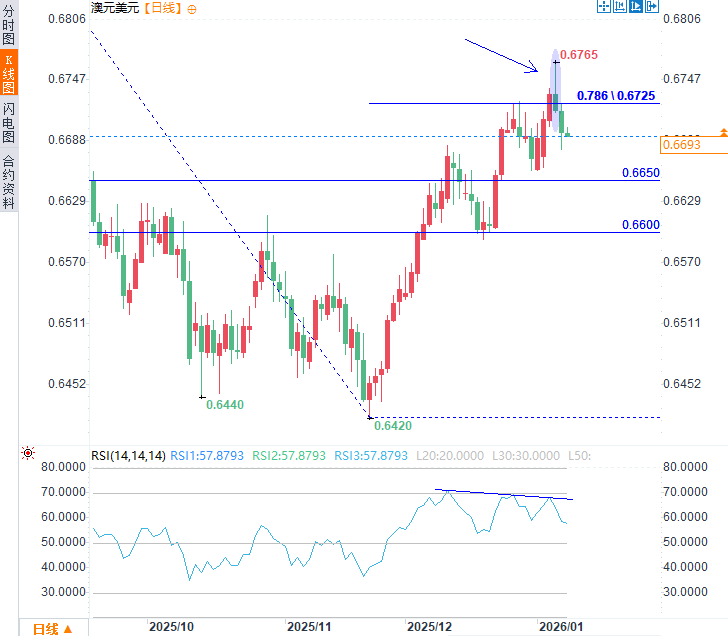
(AUD/USD daily chart, source: FX678)
At 9:29 Beijing time, the Australian dollar was trading at 0.6692/93 against the US dollar.
Non-farm payroll report expectations
Traders and economists expect the December nonfarm payroll report to show a net increase of 60,000 jobs in the U.S.; average hourly earnings are expected to rise 0.3% month-over-month (3.6% year-over-year); and the unemployment rate is expected to decline slightly to 4.5%.
Non-farm payrolls data overview
Due to the previous US government shutdown, which caused delays in fourth-quarter data releases—and in some cases, complete cancellations—economic data releases have finally returned to normal. Prior to the release of this latest round of employment market data, economists believed that the US labor market continued its trend of "low hiring, low layoffs" in December.
As shown in the chart below, traders are highly confident that the Federal Reserve will pause its rate-cutting cycle this month, and only a significant deterioration in the labor market (such as a direct decline in employment or an unemployment rate rising above 4.7%) could shake this expectation.
Therefore, the market's reaction to this data release may be relatively limited, especially considering that the U.S. Supreme Court may rule on President Trump's "emergency" tariffs about 90 minutes after the non-farm payroll data is released, which may divert some market attention.
Another reason traders may react mutedly to this data is the structural decline in the non-farm payrolls survey response rate. The chart below shows that the U.S. Bureau of Labor Statistics' survey response rate has plummeted over the past decade, indicating that the uncertainty surrounding the current employment data is far greater than in the past.
As we move into 2026 and beyond, markets should be more skeptical of all survey-based economic data and consider multiple data sources when drawing clear conclusions about the U.S. economy.
Non-farm payroll data forecast
The following historically reliable leading indicators are key references for helping to predict the monthly non-farm payroll report:
(Indicator forecast chart, source:)
Leading indicators suggest that this month's nonfarm payroll report may be higher than expected. However, given the limited survey response rate, the forecast results remain highly uncertain.
In any case, it is well known that the monthly fluctuations in this report are extremely difficult to predict, so the market should not rely too heavily on any forecast data. As always, other data in the report, including the closely watched average hourly earnings and unemployment rate, will also significantly influence the market's reaction to this report.
Potential non-farm market reaction
From a technical perspective, the US dollar index is near a one-month high (98.99) but is in the middle of a three-month range, which makes its risk profile more balanced before and after the data release.
(US Dollar Index Daily Chart, Source: FX678)
US Dollar Technical Analysis – Taking the Australian Dollar to the US Dollar as an Example
From a technical perspective, the AUD/USD pair is at a critical juncture ahead of the employment data release. Earlier this week, the pair touched a 15-month high of 0.6765 before forming a bearish "dark cloud cover" pattern on Wednesday, indicating a shift in intraday momentum from buying to selling. This reversal signal is corroborated by a triple bearish divergence – a top divergence between the pair and the 14-day Relative Strength Index (RSI), suggesting weakening upward momentum and reinforcing the assessment that the pair may have peaked recently.
If the jobs report does indeed exceed expectations, the Federal Reserve may not only completely abandon its plans for a January rate cut, but even the possibility of a March rate cut will be questioned, which would boost the US dollar. In this scenario, the AUD/USD pair may continue its decline, testing the mid-range of 0.6650, or even the previous resistance (now support) level of 0.6600. However, if the jobs data is strong and pushes the exchange rate back above its 78.6% Fibonacci retracement level of 0.6725, the current short-term bearish bias will be reversed.
(AUD/USD daily chart, source: FX678)
At 9:29 Beijing time, the Australian dollar was trading at 0.6692/93 against the US dollar.
- Risk Warning and Disclaimer
- The market involves risk, and trading may not be suitable for all investors. This article is for reference only and does not constitute personal investment advice, nor does it take into account certain users’ specific investment objectives, financial situation, or other needs. Any investment decisions made based on this information are at your own risk.