Gold and silver price alert: Risk transmission and cautious trading tips for bullish positions.
2026-01-14 21:56:11
Citigroup analysts have clearly stated that the bull market in precious metals is expected to continue its strong momentum into the first quarter of 2026, and have decisively raised their short-term price targets: gold is expected to reach $5,000 per ounce as early as the first quarter, while the target price for silver is set at $100 per ounce.
In real-time market data, international spot gold prices have stabilized above $4,600 per ounce and continue to challenge historical highs; spot silver prices have even broken through the $90 per ounce mark, setting a new historical record.
Silver outperformed gold in the market last year, with a cumulative increase of up to 150%. The underlying logic was the large-scale short squeeze that broke out in October, coupled with the long-standing supply shortage in the London spot market.
However, judging from the details of the market, gold and silver may face a test of adjustment before reaching the predicted high point for the year.
The core logic driving this year's market rally is the convergence of multiple positive factors.
On the one hand, traders have significantly increased their bets on the Federal Reserve starting a rate-cutting cycle this year. This expectation has directly driven a strong rebound in gold and silver prices, significantly increasing the demand for precious metals. The White House's extreme pressure on Powell has made the Federal Reserve pay more attention to objective economic data. The current market focus has shifted to subsequent economic data in order to seek further verification of the logic behind the rate cut.
On the other hand, geopolitical risks continue to provide strong support for gold. Iran's crackdown on domestic protests, coupled with the US's threats of intervention, continues to exacerbate risk aversion in global markets. Traders tend to increase their allocation to safe-haven assets like gold, directly generating safe-haven buying and boosting its demand resilience.
In addition, Citigroup analysts emphasized that the surge in precious metals prices was not simply driven by macroeconomic narratives, but rather by real disruptions in the logistics sector.
In particular, the prices of silver and platinum group metals have recently become unusually sensitive to inventory shifts and trade flows. This explains why the current market is far more volatile than in normal market conditions, with even the slightest disturbance triggering sharp fluctuations.
Citigroup emphasizes that market uncertainty at the beginning of 2026 will continue to be a strong support for precious metals.
In a market dominated by risk aversion, gold's hedging properties will undoubtedly attract a frenzy of capital; while silver has both financial and industrial attributes, which determines that its volatility will be significantly greater than that of gold in trending markets.
Despite gold and silver both hitting record highs at the start of the year, Citigroup maintains its core view that silver will outperform gold.
From a broader market perspective, the upward trend in precious metals is gradually spreading to a wider range of commodities, with industrial metals highly likely to take over as the new leading sector. This is precisely the core trading pattern for the commodity market in 2026: gold and silver will ride the wave in the first half of the year, while the focus in the second half will be on the catch-up opportunities in energy transition metals such as copper.
Citigroup lists U.S. trade policy as its number one risk factor, especially with the impending resolution on critical minerals under Section 232 of the U.S. Trade Act, the final outcome of which will directly determine whether tariffs or other trade restrictions will be introduced.
Even the mere expectation of rising tariffs is enough to reshape the flow of commodities and create regional supply shortages. This situation is defined as a typical binary risk game: if high tariffs are implemented, the supply gap in the physical market will widen sharply in the short term, and a surge in metal prices is inevitable; conversely, if the policy becomes clear, metal inventories that previously flowed into the United States will return at an accelerated pace, putting downward pressure on prices.
Citigroup specifically warned that this risk is a "Sword of Damocles" for silver. If it triggers a large-scale outflow of metals or inventory restructuring, silver prices will be the first to suffer a severe blow, and it may even create a "domino effect," dragging down other precious metals and even base metals in tandem.
US retail sales data and the Producer Price Index (PPI), with the PPI being a leading indicator of the CPI over 3-6 months, and sales data being a significant component of GDP growth, are highly susceptible to creating discrepancies between US economic expectations and reality. These two key data points exacerbate short-term market volatility.
However, since the year-on-year data for November retail sales was not released, although the month-on-month retail sales data showed a growth of 0.5%, exceeding the expected 0.4%, the November PPI recorded 3%, slightly higher than the expected 2.7%. This contradicted the previously lower-than-expected CPI, indicating a fluctuating inflation trend. As a result, the US dollar index was pulled in both directions and did not receive a significant boost, while gold received a slight boost as a result.
As mentioned in previous articles, silver has risen from 30 to 50, then from 50 to 70, and has now reached a measured increase of 90. This is a worthwhile profit-taking point. If it can hold above 90, the next target is 110.
At the same time, precious metals also have industrial attributes, so their correlation with the equity market needs to be considered. Recently, the equity market has shown signs of volatility and hesitation in its upward movement, which may be transmitted to precious metals.
Silver was the absolute leader in the precious metals market at the end of 2025 and the beginning of 2026. If it begins to correct, it may lead other precious metals to correct as well. However, if geopolitical risks continue to escalate, gold may buck the trend and rise independently.
Robert Kiyosaki (author of Rich Dad), a well-known financial writer who predicted that silver prices on the New York Mercantile Exchange would reach $100 per ounce, issued a key risk warning to silver investors, saying that "silver prices have entered a peak range" and that they need to be vigilant. His exact words were that this is the top.
In the short term, gold and silver may still have room to rise due to the triple support of physical supply bottlenecks, interest rate cut expectations, and geopolitical risks. However, as we enter the second half of the year, with the global geopolitical conflicts likely to ease, the "crisis premium" of gold will gradually fade, and the market focus will shift to economic growth, investment cycles, and industrial demand. Aluminum and copper, as industrial metals, are expected to take center stage in the market.
However, if future AI capital expenditures or AI company profits fall short of expectations, coupled with rising upstream raw material prices pushing up costs, the pace of capital expenditures may slow down, leading to a corresponding correction in industrial metal prices.
From a technical perspective, as mentioned in yesterday's article, spot gold corrected to the upper rail of the upward channel and found support, after which it continued to rise and reach new highs.
A short squeeze by longs and shorts may occur later, causing a rapid rise in spot gold prices. Such acceleration presents a worthwhile profit-taking opportunity.
The current resistance level is around 4700, while the support level is near the upper rail of the ascending channel and the 5-day moving average.
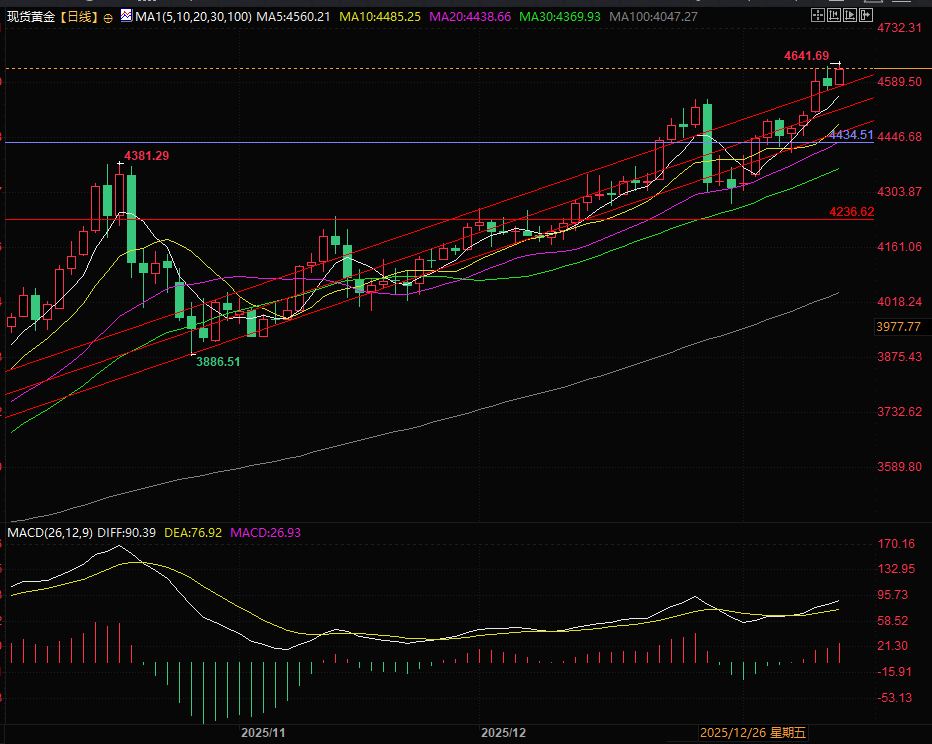
(Spot gold daily chart)
On the intraday chart, pay attention to the bottom of the trading range at 4621. When gold prices reach this area, be wary of the risk of a break below the trading range and a trend reversal.
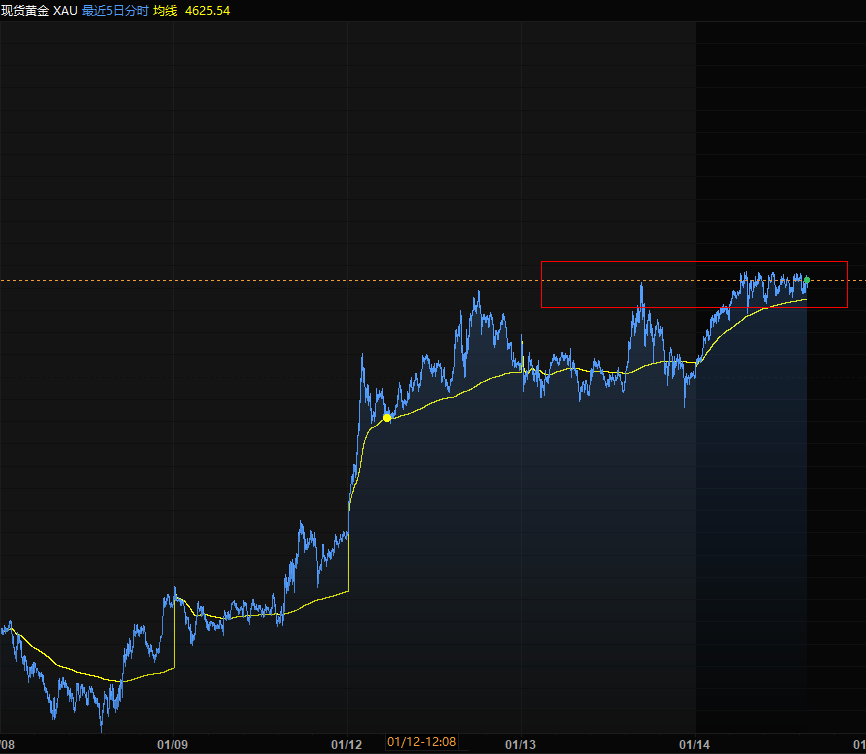
(Spot gold intraday chart, source: EasyForex)
At 21:55 Beijing time, spot gold is currently trading at $4,635 per ounce.
In real-time market data, international spot gold prices have stabilized above $4,600 per ounce and continue to challenge historical highs; spot silver prices have even broken through the $90 per ounce mark, setting a new historical record.
Silver outperformed gold in the market last year, with a cumulative increase of up to 150%. The underlying logic was the large-scale short squeeze that broke out in October, coupled with the long-standing supply shortage in the London spot market.
However, judging from the details of the market, gold and silver may face a test of adjustment before reaching the predicted high point for the year.
Core drivers: Supported by both expectations of interest rate cuts and geopolitical risks.
The core logic driving this year's market rally is the convergence of multiple positive factors.
On the one hand, traders have significantly increased their bets on the Federal Reserve starting a rate-cutting cycle this year. This expectation has directly driven a strong rebound in gold and silver prices, significantly increasing the demand for precious metals. The White House's extreme pressure on Powell has made the Federal Reserve pay more attention to objective economic data. The current market focus has shifted to subsequent economic data in order to seek further verification of the logic behind the rate cut.
On the other hand, geopolitical risks continue to provide strong support for gold. Iran's crackdown on domestic protests, coupled with the US's threats of intervention, continues to exacerbate risk aversion in global markets. Traders tend to increase their allocation to safe-haven assets like gold, directly generating safe-haven buying and boosting its demand resilience.
In addition, Citigroup analysts emphasized that the surge in precious metals prices was not simply driven by macroeconomic narratives, but rather by real disruptions in the logistics sector.
In particular, the prices of silver and platinum group metals have recently become unusually sensitive to inventory shifts and trade flows. This explains why the current market is far more volatile than in normal market conditions, with even the slightest disturbance triggering sharp fluctuations.
Market Landscape: Silver Leads the Way, Industrial Metals May Take Over in the Second Half of the Year
Citigroup emphasizes that market uncertainty at the beginning of 2026 will continue to be a strong support for precious metals.
In a market dominated by risk aversion, gold's hedging properties will undoubtedly attract a frenzy of capital; while silver has both financial and industrial attributes, which determines that its volatility will be significantly greater than that of gold in trending markets.
Despite gold and silver both hitting record highs at the start of the year, Citigroup maintains its core view that silver will outperform gold.
From a broader market perspective, the upward trend in precious metals is gradually spreading to a wider range of commodities, with industrial metals highly likely to take over as the new leading sector. This is precisely the core trading pattern for the commodity market in 2026: gold and silver will ride the wave in the first half of the year, while the focus in the second half will be on the catch-up opportunities in energy transition metals such as copper.
Risk Warning: Be wary of policy variables and short-term data fluctuations.
Citigroup lists U.S. trade policy as its number one risk factor, especially with the impending resolution on critical minerals under Section 232 of the U.S. Trade Act, the final outcome of which will directly determine whether tariffs or other trade restrictions will be introduced.
Even the mere expectation of rising tariffs is enough to reshape the flow of commodities and create regional supply shortages. This situation is defined as a typical binary risk game: if high tariffs are implemented, the supply gap in the physical market will widen sharply in the short term, and a surge in metal prices is inevitable; conversely, if the policy becomes clear, metal inventories that previously flowed into the United States will return at an accelerated pace, putting downward pressure on prices.
Citigroup specifically warned that this risk is a "Sword of Damocles" for silver. If it triggers a large-scale outflow of metals or inventory restructuring, silver prices will be the first to suffer a severe blow, and it may even create a "domino effect," dragging down other precious metals and even base metals in tandem.
Short-term disruptions: Retail sales and PPI data become key.
US retail sales data and the Producer Price Index (PPI), with the PPI being a leading indicator of the CPI over 3-6 months, and sales data being a significant component of GDP growth, are highly susceptible to creating discrepancies between US economic expectations and reality. These two key data points exacerbate short-term market volatility.
However, since the year-on-year data for November retail sales was not released, although the month-on-month retail sales data showed a growth of 0.5%, exceeding the expected 0.4%, the November PPI recorded 3%, slightly higher than the expected 2.7%. This contradicted the previously lower-than-expected CPI, indicating a fluctuating inflation trend. As a result, the US dollar index was pulled in both directions and did not receive a significant boost, while gold received a slight boost as a result.
Summary and Technical Analysis:
As mentioned in previous articles, silver has risen from 30 to 50, then from 50 to 70, and has now reached a measured increase of 90. This is a worthwhile profit-taking point. If it can hold above 90, the next target is 110.
At the same time, precious metals also have industrial attributes, so their correlation with the equity market needs to be considered. Recently, the equity market has shown signs of volatility and hesitation in its upward movement, which may be transmitted to precious metals.
Silver was the absolute leader in the precious metals market at the end of 2025 and the beginning of 2026. If it begins to correct, it may lead other precious metals to correct as well. However, if geopolitical risks continue to escalate, gold may buck the trend and rise independently.
Robert Kiyosaki (author of Rich Dad), a well-known financial writer who predicted that silver prices on the New York Mercantile Exchange would reach $100 per ounce, issued a key risk warning to silver investors, saying that "silver prices have entered a peak range" and that they need to be vigilant. His exact words were that this is the top.
In the short term, gold and silver may still have room to rise due to the triple support of physical supply bottlenecks, interest rate cut expectations, and geopolitical risks. However, as we enter the second half of the year, with the global geopolitical conflicts likely to ease, the "crisis premium" of gold will gradually fade, and the market focus will shift to economic growth, investment cycles, and industrial demand. Aluminum and copper, as industrial metals, are expected to take center stage in the market.
However, if future AI capital expenditures or AI company profits fall short of expectations, coupled with rising upstream raw material prices pushing up costs, the pace of capital expenditures may slow down, leading to a corresponding correction in industrial metal prices.
From a technical perspective, as mentioned in yesterday's article, spot gold corrected to the upper rail of the upward channel and found support, after which it continued to rise and reach new highs.
A short squeeze by longs and shorts may occur later, causing a rapid rise in spot gold prices. Such acceleration presents a worthwhile profit-taking opportunity.
The current resistance level is around 4700, while the support level is near the upper rail of the ascending channel and the 5-day moving average.
(Spot gold daily chart)
On the intraday chart, pay attention to the bottom of the trading range at 4621. When gold prices reach this area, be wary of the risk of a break below the trading range and a trend reversal.
(Spot gold intraday chart, source: EasyForex)
At 21:55 Beijing time, spot gold is currently trading at $4,635 per ounce.
- Risk Warning and Disclaimer
- The market involves risk, and trading may not be suitable for all investors. This article is for reference only and does not constitute personal investment advice, nor does it take into account certain users’ specific investment objectives, financial situation, or other needs. Any investment decisions made based on this information are at your own risk.