Gold remains stagnant, while silver fluctuates wildly. Who is manipulating the nerves of precious metals?
2026-01-15 20:26:34
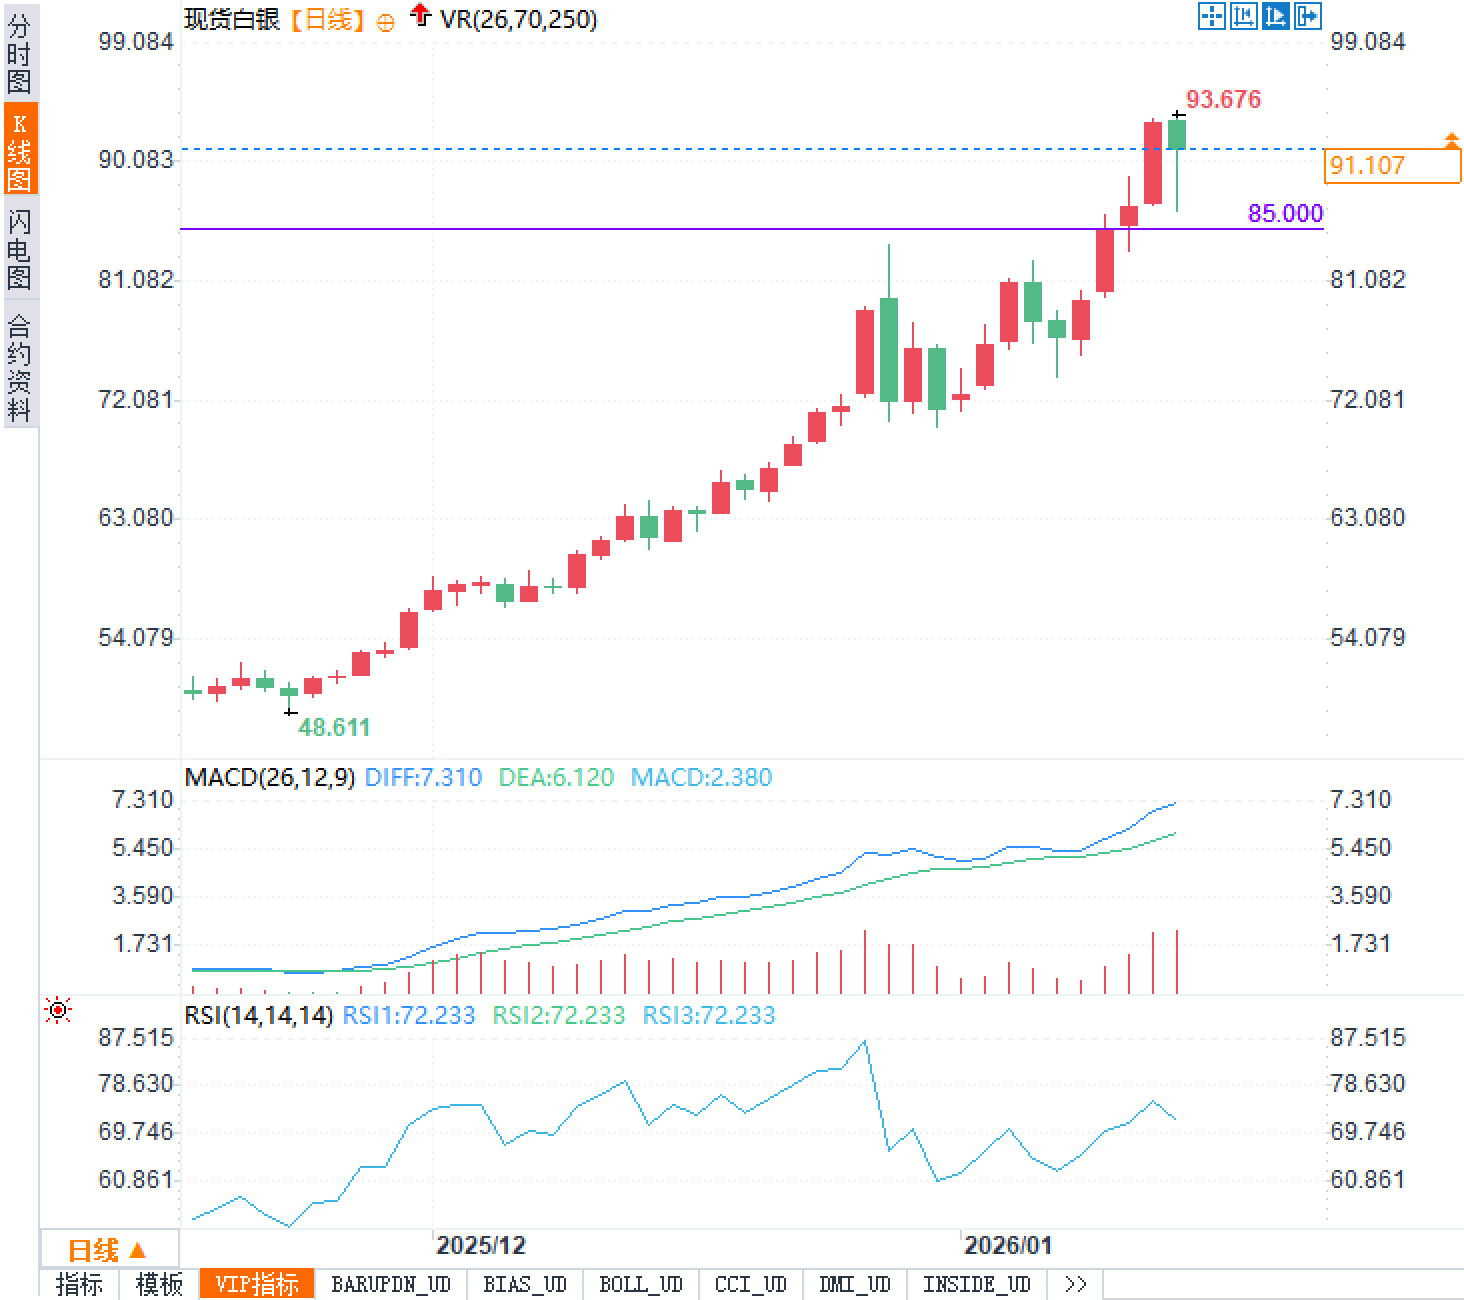
On Thursday (January 15), spot silver traded above $91 in pre-market US trading. During the Asian session, however, the price plunged to $86.288, a pullback of nearly 8%, exhibiting significant volatility. However, as risk sentiment stabilized during the European session, silver quickly recovered, narrowing its losses to approximately 2% and regaining the $91 mark. This "sell-off followed by a rebound" pattern indicates strong buying support on dips in the market.
It's worth noting that this sharp drop wasn't triggered by any major breaking news, but rather appeared to be a technical plunge caused by profit-taking from earlier gains coupled with insufficient liquidity. In other words, there were no new variables in the market sufficient to overturn the medium-term trend; rather, it was more about funds rebalancing their positions in a highly volatile environment—selling to lock in profits and then waiting to buy back at lower levels. Because of this, the market is easily influenced by key technical levels and order flow, resulting in a structure of rapid declines followed by quick rebounds. This also explains the recent frequent "upward surges and downward washouts" in silver prices.
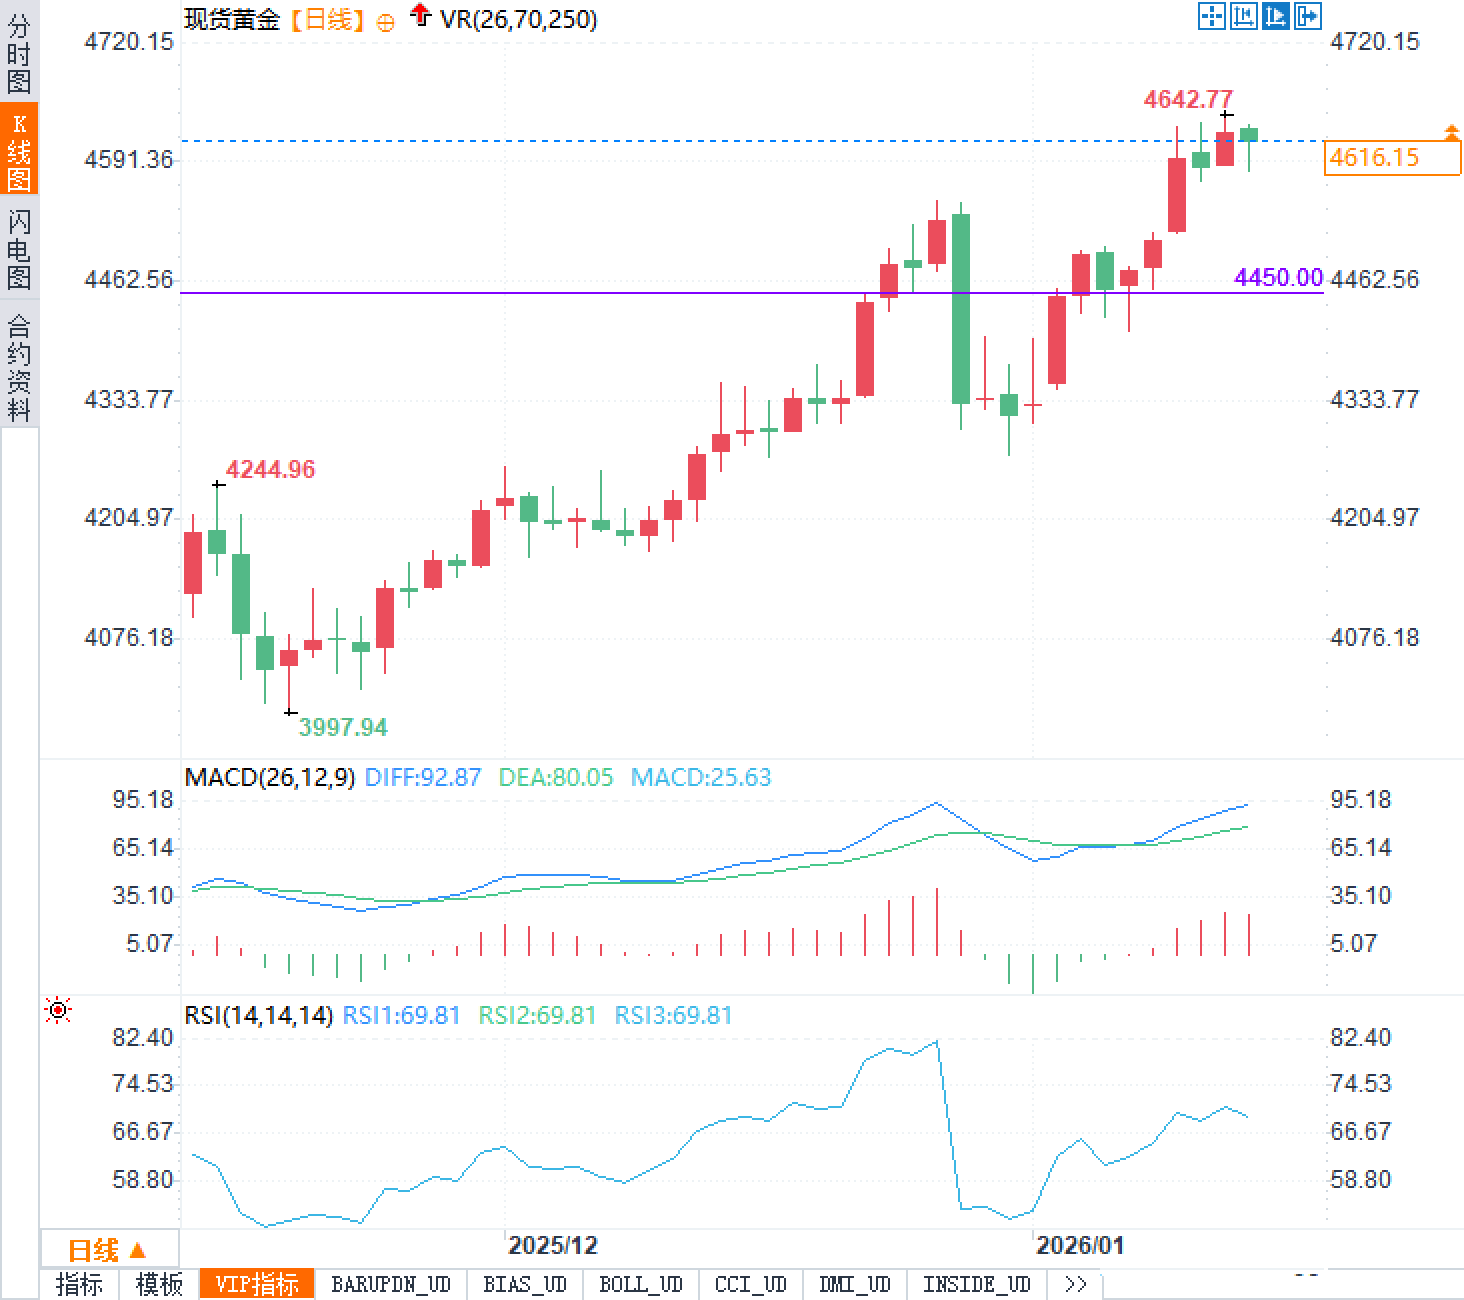
Gold's performance has been relatively restrained, currently stable around $4615, with only a slight decline of 0.2% for the day. Compared to the dramatic fluctuations in silver, gold's trend has been more orderly, indicating that funds have not completely withdrawn from the precious metals sector, but rather have engaged in more aggressive short-term profit-taking in highly volatile commodities like silver. Gold's stability has also provided a buffer for sentiment in the entire precious metals market, preventing panic from spreading.
Despite sharp short-term fluctuations, analysts believe that the strong upward trend in silver since mid-2025 remains unbroken. In the long term, this rally is supported by solid fundamentals. First, persistent market expectations of a supply-demand gap keep traders highly sensitive to the actual available supply of silver. Second, its industrial attributes contribute to strong demand resilience, particularly in emerging sectors such as photovoltaics, electric vehicles, and grid upgrades, where price pullbacks often attract allocation-oriented buying. Finally, the strong performance of gold has also driven spillover demand, pushing funds into silver and amplifying its price elasticity.
These three factors together form a "structurally bullish" foundation, allowing silver to continue its upward trend in early 2026. However, any asset that rises too quickly will inevitably create hidden dangers—the speed itself increases the probability of a short-term pullback, especially when the price approaches key resistance areas, where selling pressure is more likely to be concentrated. The recent intraday drop below $87 was precisely a test of the psychological defenses of the bulls at higher levels.
Another noteworthy phenomenon is the change in the gold-silver ratio. This ratio previously plummeted from a high of nearly 105 to around 50, reflecting a significant outperformance of silver over gold in the short term. While this level is still some distance from historical extremes (such as 30 in 2011), the rapid decline suggests that a "tactical pullback" is underway. Typically, a rapid compression of the gold-silver ratio can indicate two scenarios: either silver's rally is a healthy catch-up, or it has entered an overheated state and faces pressure to revert to the mean. Currently, the former seems more dominant, but as prices approach resistance levels, the risk of the latter is gradually increasing.
Looking at the open interest data, this round of silver price increases doesn't resemble a typical "crowded trade." Data shows that after peaking in late December, related fund holdings fell by about 2-3% in mid-January; while the number of non-commercial net long contracts decreased from approximately 45,000 in mid-December to 29,271 on January 6th, while silver prices surged by over 40% during the same period. This divergence suggests that the main driver of the price increase was not leveraged funds chasing the rally, but rather the gradual intervention of real asset allocation demand and trend-following funds.
This non-crowded state has two important implications: on the one hand, the medium-term trend is less likely to collapse suddenly due to a "bullish stampede," making the trend more sustainable; on the other hand, sharp pullbacks may still occur in the short term, because in a highly volatile environment, stop-loss orders and profit-taking will be triggered in a concentrated manner, especially in the absence of new information to guide the market.
Furthermore, rental rates remain moderate, and the forward curve shows a futures premium structure, indicating that this round of price increases is not due to extreme shortages in the spot market, but rather driven more by market expectations and financial attributes. When physical supply and demand are not significant, prices are more susceptible to risk appetite and technical factors, making it difficult for volatility to naturally subside. Therefore, instead of obsessively searching for a single piece of news to explain market movements, it is more effective to focus on the battle and defense of key price levels and changes in momentum; this is the core of grasping the rhythm.
It's worth noting that this sharp drop wasn't triggered by any major breaking news, but rather appeared to be a technical plunge caused by profit-taking from earlier gains coupled with insufficient liquidity. In other words, there were no new variables in the market sufficient to overturn the medium-term trend; rather, it was more about funds rebalancing their positions in a highly volatile environment—selling to lock in profits and then waiting to buy back at lower levels. Because of this, the market is easily influenced by key technical levels and order flow, resulting in a structure of rapid declines followed by quick rebounds. This also explains the recent frequent "upward surges and downward washouts" in silver prices.
Gold's performance has been relatively restrained, currently stable around $4615, with only a slight decline of 0.2% for the day. Compared to the dramatic fluctuations in silver, gold's trend has been more orderly, indicating that funds have not completely withdrawn from the precious metals sector, but rather have engaged in more aggressive short-term profit-taking in highly volatile commodities like silver. Gold's stability has also provided a buffer for sentiment in the entire precious metals market, preventing panic from spreading.
The medium-term logic remains intact: the three major support levels are still in place, but the rapid rise conceals the risk of a pullback.
Despite sharp short-term fluctuations, analysts believe that the strong upward trend in silver since mid-2025 remains unbroken. In the long term, this rally is supported by solid fundamentals. First, persistent market expectations of a supply-demand gap keep traders highly sensitive to the actual available supply of silver. Second, its industrial attributes contribute to strong demand resilience, particularly in emerging sectors such as photovoltaics, electric vehicles, and grid upgrades, where price pullbacks often attract allocation-oriented buying. Finally, the strong performance of gold has also driven spillover demand, pushing funds into silver and amplifying its price elasticity.
These three factors together form a "structurally bullish" foundation, allowing silver to continue its upward trend in early 2026. However, any asset that rises too quickly will inevitably create hidden dangers—the speed itself increases the probability of a short-term pullback, especially when the price approaches key resistance areas, where selling pressure is more likely to be concentrated. The recent intraday drop below $87 was precisely a test of the psychological defenses of the bulls at higher levels.
Another noteworthy phenomenon is the change in the gold-silver ratio. This ratio previously plummeted from a high of nearly 105 to around 50, reflecting a significant outperformance of silver over gold in the short term. While this level is still some distance from historical extremes (such as 30 in 2011), the rapid decline suggests that a "tactical pullback" is underway. Typically, a rapid compression of the gold-silver ratio can indicate two scenarios: either silver's rally is a healthy catch-up, or it has entered an overheated state and faces pressure to revert to the mean. Currently, the former seems more dominant, but as prices approach resistance levels, the risk of the latter is gradually increasing.
Fund flows reveal the truth: It's not a bull market frenzy, but it shouldn't be underestimated.
Looking at the open interest data, this round of silver price increases doesn't resemble a typical "crowded trade." Data shows that after peaking in late December, related fund holdings fell by about 2-3% in mid-January; while the number of non-commercial net long contracts decreased from approximately 45,000 in mid-December to 29,271 on January 6th, while silver prices surged by over 40% during the same period. This divergence suggests that the main driver of the price increase was not leveraged funds chasing the rally, but rather the gradual intervention of real asset allocation demand and trend-following funds.
This non-crowded state has two important implications: on the one hand, the medium-term trend is less likely to collapse suddenly due to a "bullish stampede," making the trend more sustainable; on the other hand, sharp pullbacks may still occur in the short term, because in a highly volatile environment, stop-loss orders and profit-taking will be triggered in a concentrated manner, especially in the absence of new information to guide the market.
Furthermore, rental rates remain moderate, and the forward curve shows a futures premium structure, indicating that this round of price increases is not due to extreme shortages in the spot market, but rather driven more by market expectations and financial attributes. When physical supply and demand are not significant, prices are more susceptible to risk appetite and technical factors, making it difficult for volatility to naturally subside. Therefore, instead of obsessively searching for a single piece of news to explain market movements, it is more effective to focus on the battle and defense of key price levels and changes in momentum; this is the core of grasping the rhythm.
- Risk Warning and Disclaimer
- The market involves risk, and trading may not be suitable for all investors. This article is for reference only and does not constitute personal investment advice, nor does it take into account certain users’ specific investment objectives, financial situation, or other needs. Any investment decisions made based on this information are at your own risk.