Gold targets $5,000, structural bull market accelerates upward.
2026-01-23 19:18:42
Gold is making a breakout attempt towards the key $5,000/ounce level, with market sentiment fervent and bullish momentum continuing to surge. As of Friday (January 23), spot gold (XAU/USD) touched a record high of $4,967.19/ounce. After setting the record, it retreated slightly due to short-term profit-taking and is currently trading within the $4,900–$4,930 range.

From the market performance, the buying support during the pullback was exceptionally strong, with funds quickly flowing back in at each small dip, confirming the highly concentrated bullish consensus in the market for gold. Since the beginning of this week, gold prices have achieved four consecutive days of strong gains, with a cumulative increase of over 7.2%, marking the highest weekly increase in nearly three months. Looking at a longer timeframe, gold prices have risen between 9.88% and 10.21% over the past month, with an annual increase soaring to 77% to 78%, far exceeding market expectations at the beginning of the year.
Driven by gold, the precious metals sector experienced a comprehensive surge, exhibiting characteristics of a structural bull market with "all metals rising and all metals strengthening together." Silver simultaneously broke historical records, with prices approaching the $99-$100/ounce range, and intraday volatility exceeding 3%, following gold into an accelerated upward trend.
Core drivers: Escalating US-EU confrontation and concentrated inflow of safe-haven funds
The core driver behind gold's recent record high has shifted from traditional expectations of Federal Reserve policy to escalating geopolitical tensions between the US and Europe and a concentrated influx of global safe-haven funds. Although the US dollar index recorded its biggest weekly drop in seven months this week, briefly breaking through a key support level, providing some support for gold prices, this is more of a byproduct of fund rotation amid geopolitical conflicts than a core driver. The current market focus is on the US-EU struggle over interests surrounding Greenland. The Trump administration previously proposed imposing a 10% tariff on eight European countries and planned to raise the rate to 25% by the end of June. Coupled with the US Supreme Court's failure to rule on related tariff cases and official appointments, US-EU relations have once again become strained.
The escalating market panic triggered by geopolitical conflicts has become a key catalyst for gold price breakthroughs. Since January 20, affected by the US-EU dispute and the sell-off of Japanese government bonds, the US financial market has suffered a triple whammy of stock, bond, and currency losses. The VIX index, which measures market fear, surged to 20.09, a new high since November last year, as safe-haven funds accelerated their withdrawal from risky assets and flowed into the gold market.
It is worth noting that even though the US economic data showed resilience (Q3 GDP final reading of 4.4% exceeded expectations, core PCE inflation was under control at 2.8%, and initial jobless claims were 200,000 lower than expected), it failed to divert safe-haven funds from allocating to gold. On the contrary, the robust economy enhanced gold's attractiveness against volatility, driving funds to further concentrate in the precious metals sector.
Geopolitical uncertainties coupled with debt risks in developed economies have triggered a restructuring of global asset allocation logic, further solidifying the gold price rally. The 10-year US Treasury yield fell to around 4.2%, down nearly 30 basis points from its previous month's high. European funds, concerned about the safety of dollar assets, plan to reduce their holdings of US Treasuries before the end of the month, making gold, as a reserve asset with "no counterparty risk," the optimal alternative. Significant fund rotation is evident, with holdings in the world's largest gold ETF—SPDR—rising to a more than two-year high of 1085.67 tons on January 16, a year-on-year increase of 24.9%, reflecting a resonance between private sector and institutional funds.
Analysts point out that gold has now broken away from the traditional negative correlation between the US dollar and gold. The safe-haven demand triggered by geopolitical frictions between the US and Europe, along with the demand for diversified global asset allocation, have jointly supported gold prices to break out of their own strong trend. This logic is more sustainable than the Fed's policy expectations.
Supporting catalysts: Easing geopolitical tensions did not hinder the demand for de-dollarization, and the dual-engine growth model solidified the upward trend.
The recent easing of short-term geopolitical tensions has not substantially suppressed the rise in gold prices. The Trump administration softened its tariff threats against Greenland and reached a new cooperation framework with NATO, temporarily easing diplomatic tensions between the US and Europe. Market risk appetite has rebounded somewhat, and US stocks have seen a temporary recovery. This led to some short-term safe-haven funds withdrawing from the gold market, triggering a slight profit-taking. However, judging from the market performance, this pullback was extremely shallow and short-lived, indicating that safe-haven demand is only a secondary factor driving the rise in gold prices; the core driver has shifted to the more long-term demand for de-dollarization.
The core catalyst for current gold demand stems from the diversified asset allocation needs of private investors and emerging market central banks, and this demand is accelerating. From a central bank perspective, global central bank gold purchases exhibit structural and continuous characteristics, with monthly purchases averaging around 60 tons. Total purchases in 2025 have already surpassed historical peaks, and this trend showed no signs of slowing down in early 2026. Emerging market central banks continue to increase their gold holdings, primarily to reduce the proportion of dollar assets in their foreign exchange reserves, mitigate dollar exchange rate fluctuations and geopolitical risks, and strengthen the security and neutrality of their reserve assets. Gold's attribute as a "non-sovereign currency asset" is becoming increasingly prominent.
The private sector closely followed the central bank's gold-buying trend, forming a dual-driven pattern of "central bank support and private sector buying." On the one hand, the central bank's continued gold purchases provided solid bottom support for gold prices, effectively offsetting the downward pressure caused by short-term profit-taking. On the other hand, private investors, driven by multiple needs such as hedging against global macroeconomic policy risks, combating potential inflation, and avoiding exchange rate fluctuations, accelerated their allocation of gold assets. Inflows into multiple channels, including ETFs, physical gold, and gold futures, all reached new highs, further amplifying the rise in gold prices. This dual-driven demand structure makes the gold market more sustainable and resistant to volatility.
Major banks reach consensus: collectively raising target prices, bullish sentiment is unprecedentedly unified.
With gold prices breaking historical highs, major investment banks have recently updated their research reports in quick succession, collectively raising their 2026 gold price targets, further strengthening the bullish consensus in the market. While the opinions of various institutions differ on specific target prices, they all acknowledge the structural bullish trend in gold and generally believe that the $5,000/ounce mark is achievable in the short term. The core logic revolves around three dimensions: the activation of diversified demand from the private sector, continued central bank gold purchases, and increased global policy uncertainty.
Goldman Sachs has significantly raised its year-end 2026 gold price target to $5,400 per ounce from $4,900, an increase of 10.2%. Goldman Sachs points out that the private sector's demand for asset diversification to hedge against global macroeconomic policy risks has been fully realized, and this demand will continue throughout 2026. The upside risks to gold prices are significantly skewed positive, and a breakthrough of $5,500 within the year cannot be ruled out.
JPMorgan Chase predicts that gold prices will approach $5,000 per ounce in Q4 2026, with an annual average price of $5,055 per ounce. In the long term, supported by continued strong demand from central banks and private investors, gold prices are expected to reach $6,000 per ounce. JPMorgan Chase estimates that global quarterly gold demand will reach an average of 585 tons in 2026, and the widening supply-demand gap will drive prices further upward.
UBS maintains its bullish view on gold in 2026, raising its price target to $5,400 per ounce. The bank believes gold prices could quickly break through the psychological barrier of $5,000 in the first half of the year, with demand remaining strong as a key hedging tool in global investment portfolios. However, the bank also warns of a potential mild pullback towards the end of the year, expecting a correction to around $4,800 per ounce, primarily due to profit-taking and the rebalancing of funds following expectations of interest rate cuts.
HSBC remains cautious but bullish, forecasting a peak gold price of $5,050/oz in the first half of 2026, with an average price of $4,587/oz for the year, before falling back to around $4,450/oz by the end of the year. HSBC emphasizes that gold market volatility will increase significantly in 2026, but structural demand from central bank gold purchases will provide strong support for prices, limiting downside potential.
Bank of America has set a 2026 gold price target of $5,000 per ounce, believing that $5,000 is a key level that will inevitably be reached within the year; Jefferies Group has given a more aggressive forecast, with a target price as high as $6,600 per ounce, based on the core logic of the accelerating trend of de-dollarization and the increasing global debt pressure.
Mainstream Wall Street institutions predict an average gold price increase of 15%–25% in 2026, with peak prices expected to be between $5,000 and $6,600 per ounce. Overall, market consensus is largely unified: $5,000 per ounce is achievable in the short term, and the structural bull market trend for gold will continue into 2026.
Technical Analysis: The strong upward trend remains unchanged, with a short-term target of $5,000.
From a technical perspective, gold is currently in a textbook-perfect strong uptrend, with its upward potential fully unlocked after breaking through key resistance. The 4-hour chart shows that after breaking through the key resistance level of $4,780/oz, gold prices did not experience a pullback for confirmation but instead directly entered an accelerated upward mode, reaching a new all-time high of $4,967/oz. Momentum indicators (such as MACD and KDJ) all confirm that the upward momentum remains ample, and the short-term uptrend is solid. Although the current RSI indicator is in extremely overbought territory, indicating potential short-term pullback pressure, the pullback has been very shallow and quickly absorbed by buying pressure. The $4,775-$4,800 range has formed solid support, with strong buying interest on dips, and the bulls' control over the market has not weakened in the slightest.
The latest high-frequency trading data shows that the current upward trend in gold fully conforms to the textbook characteristics of a strong upward trend. Even with the recovery of market risk appetite and the rebound in US stocks, it has failed to effectively suppress gold prices. Instead, it has become an opportunity for some funds to take profits and reposition in gold, further strengthening the resilience of the upward trend.
Key resistance and support levels
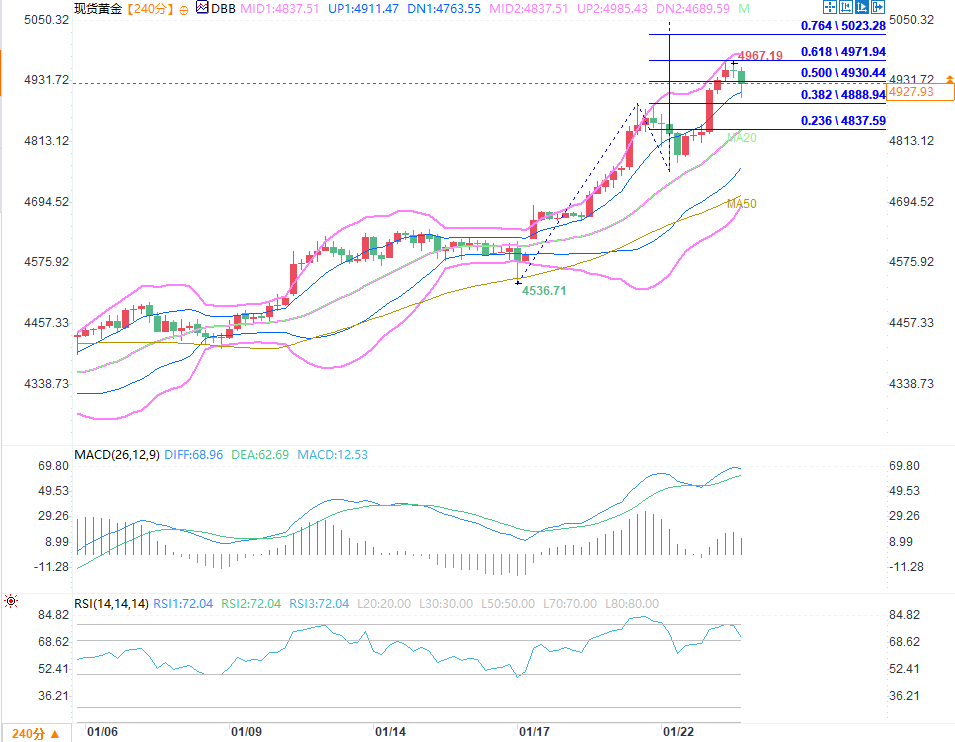
(4-hour chart of spot gold source: EasyForex)
Resistance levels: Gold prices are currently testing the 0.618 extension of the Fibonacci retracement level ($4,971.94/oz), which forms a confluence of resistance with the previous all-time high. A sustained hold above this level would open up further upside potential. The next resistance levels to watch are the 0.764 extension ($5,023.28/oz), which is close to the psychological level of $5,000. A break above this level would confirm a new acceleration phase for gold prices. Higher resistance levels are the 1.000 extension ($5,106.29/oz) and the 1.272 extension ($5,201.35/oz), which will be key upside targets for the first half of 2026.
Support levels: For short-term support, the 0.500 level on the Bollinger Bands (US$4,930.44/oz) is the primary focus. Gold prices are currently consolidating around this range. If prices pull back to this level and stabilize, it would be in line with the corrective rhythm of a strong uptrend, accumulating momentum for a subsequent push to new highs. Stronger support lies at the 0.382 extension level on the Bollinger Bands (US$4,888.94/oz). This level coincides with the middle Bollinger Bands and forms a confluence of support, representing a key defensive zone for the current bullish trend. A break below this level could trigger a deeper correction in the short term.
Overall, gold is currently in a phase of testing resistance and short-term overbought conditions within a strong upward trend, and the overall bullish pattern remains largely unchanged. Even if a pullback occurs, the magnitude will be relatively limited, with a more likely scenario of consolidation through time, stabilizing near key support levels before continuing to test higher price targets.
Short-term risks and catalysts outlook
Despite the solid fundamentals of the gold market's structural bullish trend, several short-term risks remain, potentially triggering periodic volatility. Tonight, the US will release its PMI data, with the manufacturing PMI expected at 51.9 and the services PMI at 52.9. Stronger-than-expected data could briefly boost the US dollar index, triggering profit-taking in the gold market.
The upcoming FOMC meeting next week is the key event affecting gold prices in the short term. If the Fed adopts a hawkish stance, emphasizing maintaining high interest rates until Q2 2026, it could temporarily reverse market expectations of rate cuts, leading to significant fluctuations in gold prices. Conversely, if the Fed releases dovish signals, confirming that a rate-cutting cycle is imminent, it will provide strong momentum for gold prices to break through $5,000.
Mainstream institutions generally believe that volatility in the gold market will increase significantly in 2026, but the structural upward trend remains solid. Core driving factors such as inflation hedging demand, escalating global debt pressure, and accelerated de-dollarization remain unchanged, and these long-term factors will continue to support rising gold prices.
From the market performance, the buying support during the pullback was exceptionally strong, with funds quickly flowing back in at each small dip, confirming the highly concentrated bullish consensus in the market for gold. Since the beginning of this week, gold prices have achieved four consecutive days of strong gains, with a cumulative increase of over 7.2%, marking the highest weekly increase in nearly three months. Looking at a longer timeframe, gold prices have risen between 9.88% and 10.21% over the past month, with an annual increase soaring to 77% to 78%, far exceeding market expectations at the beginning of the year.
Driven by gold, the precious metals sector experienced a comprehensive surge, exhibiting characteristics of a structural bull market with "all metals rising and all metals strengthening together." Silver simultaneously broke historical records, with prices approaching the $99-$100/ounce range, and intraday volatility exceeding 3%, following gold into an accelerated upward trend.
Core drivers: Escalating US-EU confrontation and concentrated inflow of safe-haven funds
The core driver behind gold's recent record high has shifted from traditional expectations of Federal Reserve policy to escalating geopolitical tensions between the US and Europe and a concentrated influx of global safe-haven funds. Although the US dollar index recorded its biggest weekly drop in seven months this week, briefly breaking through a key support level, providing some support for gold prices, this is more of a byproduct of fund rotation amid geopolitical conflicts than a core driver. The current market focus is on the US-EU struggle over interests surrounding Greenland. The Trump administration previously proposed imposing a 10% tariff on eight European countries and planned to raise the rate to 25% by the end of June. Coupled with the US Supreme Court's failure to rule on related tariff cases and official appointments, US-EU relations have once again become strained.
The escalating market panic triggered by geopolitical conflicts has become a key catalyst for gold price breakthroughs. Since January 20, affected by the US-EU dispute and the sell-off of Japanese government bonds, the US financial market has suffered a triple whammy of stock, bond, and currency losses. The VIX index, which measures market fear, surged to 20.09, a new high since November last year, as safe-haven funds accelerated their withdrawal from risky assets and flowed into the gold market.
It is worth noting that even though the US economic data showed resilience (Q3 GDP final reading of 4.4% exceeded expectations, core PCE inflation was under control at 2.8%, and initial jobless claims were 200,000 lower than expected), it failed to divert safe-haven funds from allocating to gold. On the contrary, the robust economy enhanced gold's attractiveness against volatility, driving funds to further concentrate in the precious metals sector.
Geopolitical uncertainties coupled with debt risks in developed economies have triggered a restructuring of global asset allocation logic, further solidifying the gold price rally. The 10-year US Treasury yield fell to around 4.2%, down nearly 30 basis points from its previous month's high. European funds, concerned about the safety of dollar assets, plan to reduce their holdings of US Treasuries before the end of the month, making gold, as a reserve asset with "no counterparty risk," the optimal alternative. Significant fund rotation is evident, with holdings in the world's largest gold ETF—SPDR—rising to a more than two-year high of 1085.67 tons on January 16, a year-on-year increase of 24.9%, reflecting a resonance between private sector and institutional funds.
Analysts point out that gold has now broken away from the traditional negative correlation between the US dollar and gold. The safe-haven demand triggered by geopolitical frictions between the US and Europe, along with the demand for diversified global asset allocation, have jointly supported gold prices to break out of their own strong trend. This logic is more sustainable than the Fed's policy expectations.
Supporting catalysts: Easing geopolitical tensions did not hinder the demand for de-dollarization, and the dual-engine growth model solidified the upward trend.
The recent easing of short-term geopolitical tensions has not substantially suppressed the rise in gold prices. The Trump administration softened its tariff threats against Greenland and reached a new cooperation framework with NATO, temporarily easing diplomatic tensions between the US and Europe. Market risk appetite has rebounded somewhat, and US stocks have seen a temporary recovery. This led to some short-term safe-haven funds withdrawing from the gold market, triggering a slight profit-taking. However, judging from the market performance, this pullback was extremely shallow and short-lived, indicating that safe-haven demand is only a secondary factor driving the rise in gold prices; the core driver has shifted to the more long-term demand for de-dollarization.
The core catalyst for current gold demand stems from the diversified asset allocation needs of private investors and emerging market central banks, and this demand is accelerating. From a central bank perspective, global central bank gold purchases exhibit structural and continuous characteristics, with monthly purchases averaging around 60 tons. Total purchases in 2025 have already surpassed historical peaks, and this trend showed no signs of slowing down in early 2026. Emerging market central banks continue to increase their gold holdings, primarily to reduce the proportion of dollar assets in their foreign exchange reserves, mitigate dollar exchange rate fluctuations and geopolitical risks, and strengthen the security and neutrality of their reserve assets. Gold's attribute as a "non-sovereign currency asset" is becoming increasingly prominent.
The private sector closely followed the central bank's gold-buying trend, forming a dual-driven pattern of "central bank support and private sector buying." On the one hand, the central bank's continued gold purchases provided solid bottom support for gold prices, effectively offsetting the downward pressure caused by short-term profit-taking. On the other hand, private investors, driven by multiple needs such as hedging against global macroeconomic policy risks, combating potential inflation, and avoiding exchange rate fluctuations, accelerated their allocation of gold assets. Inflows into multiple channels, including ETFs, physical gold, and gold futures, all reached new highs, further amplifying the rise in gold prices. This dual-driven demand structure makes the gold market more sustainable and resistant to volatility.
Major banks reach consensus: collectively raising target prices, bullish sentiment is unprecedentedly unified.
With gold prices breaking historical highs, major investment banks have recently updated their research reports in quick succession, collectively raising their 2026 gold price targets, further strengthening the bullish consensus in the market. While the opinions of various institutions differ on specific target prices, they all acknowledge the structural bullish trend in gold and generally believe that the $5,000/ounce mark is achievable in the short term. The core logic revolves around three dimensions: the activation of diversified demand from the private sector, continued central bank gold purchases, and increased global policy uncertainty.
Goldman Sachs has significantly raised its year-end 2026 gold price target to $5,400 per ounce from $4,900, an increase of 10.2%. Goldman Sachs points out that the private sector's demand for asset diversification to hedge against global macroeconomic policy risks has been fully realized, and this demand will continue throughout 2026. The upside risks to gold prices are significantly skewed positive, and a breakthrough of $5,500 within the year cannot be ruled out.
JPMorgan Chase predicts that gold prices will approach $5,000 per ounce in Q4 2026, with an annual average price of $5,055 per ounce. In the long term, supported by continued strong demand from central banks and private investors, gold prices are expected to reach $6,000 per ounce. JPMorgan Chase estimates that global quarterly gold demand will reach an average of 585 tons in 2026, and the widening supply-demand gap will drive prices further upward.
UBS maintains its bullish view on gold in 2026, raising its price target to $5,400 per ounce. The bank believes gold prices could quickly break through the psychological barrier of $5,000 in the first half of the year, with demand remaining strong as a key hedging tool in global investment portfolios. However, the bank also warns of a potential mild pullback towards the end of the year, expecting a correction to around $4,800 per ounce, primarily due to profit-taking and the rebalancing of funds following expectations of interest rate cuts.
HSBC remains cautious but bullish, forecasting a peak gold price of $5,050/oz in the first half of 2026, with an average price of $4,587/oz for the year, before falling back to around $4,450/oz by the end of the year. HSBC emphasizes that gold market volatility will increase significantly in 2026, but structural demand from central bank gold purchases will provide strong support for prices, limiting downside potential.
Bank of America has set a 2026 gold price target of $5,000 per ounce, believing that $5,000 is a key level that will inevitably be reached within the year; Jefferies Group has given a more aggressive forecast, with a target price as high as $6,600 per ounce, based on the core logic of the accelerating trend of de-dollarization and the increasing global debt pressure.
Mainstream Wall Street institutions predict an average gold price increase of 15%–25% in 2026, with peak prices expected to be between $5,000 and $6,600 per ounce. Overall, market consensus is largely unified: $5,000 per ounce is achievable in the short term, and the structural bull market trend for gold will continue into 2026.
Technical Analysis: The strong upward trend remains unchanged, with a short-term target of $5,000.
From a technical perspective, gold is currently in a textbook-perfect strong uptrend, with its upward potential fully unlocked after breaking through key resistance. The 4-hour chart shows that after breaking through the key resistance level of $4,780/oz, gold prices did not experience a pullback for confirmation but instead directly entered an accelerated upward mode, reaching a new all-time high of $4,967/oz. Momentum indicators (such as MACD and KDJ) all confirm that the upward momentum remains ample, and the short-term uptrend is solid. Although the current RSI indicator is in extremely overbought territory, indicating potential short-term pullback pressure, the pullback has been very shallow and quickly absorbed by buying pressure. The $4,775-$4,800 range has formed solid support, with strong buying interest on dips, and the bulls' control over the market has not weakened in the slightest.
The latest high-frequency trading data shows that the current upward trend in gold fully conforms to the textbook characteristics of a strong upward trend. Even with the recovery of market risk appetite and the rebound in US stocks, it has failed to effectively suppress gold prices. Instead, it has become an opportunity for some funds to take profits and reposition in gold, further strengthening the resilience of the upward trend.
Key resistance and support levels
(4-hour chart of spot gold source: EasyForex)
Resistance levels: Gold prices are currently testing the 0.618 extension of the Fibonacci retracement level ($4,971.94/oz), which forms a confluence of resistance with the previous all-time high. A sustained hold above this level would open up further upside potential. The next resistance levels to watch are the 0.764 extension ($5,023.28/oz), which is close to the psychological level of $5,000. A break above this level would confirm a new acceleration phase for gold prices. Higher resistance levels are the 1.000 extension ($5,106.29/oz) and the 1.272 extension ($5,201.35/oz), which will be key upside targets for the first half of 2026.
Support levels: For short-term support, the 0.500 level on the Bollinger Bands (US$4,930.44/oz) is the primary focus. Gold prices are currently consolidating around this range. If prices pull back to this level and stabilize, it would be in line with the corrective rhythm of a strong uptrend, accumulating momentum for a subsequent push to new highs. Stronger support lies at the 0.382 extension level on the Bollinger Bands (US$4,888.94/oz). This level coincides with the middle Bollinger Bands and forms a confluence of support, representing a key defensive zone for the current bullish trend. A break below this level could trigger a deeper correction in the short term.
Overall, gold is currently in a phase of testing resistance and short-term overbought conditions within a strong upward trend, and the overall bullish pattern remains largely unchanged. Even if a pullback occurs, the magnitude will be relatively limited, with a more likely scenario of consolidation through time, stabilizing near key support levels before continuing to test higher price targets.
Short-term risks and catalysts outlook
Despite the solid fundamentals of the gold market's structural bullish trend, several short-term risks remain, potentially triggering periodic volatility. Tonight, the US will release its PMI data, with the manufacturing PMI expected at 51.9 and the services PMI at 52.9. Stronger-than-expected data could briefly boost the US dollar index, triggering profit-taking in the gold market.
The upcoming FOMC meeting next week is the key event affecting gold prices in the short term. If the Fed adopts a hawkish stance, emphasizing maintaining high interest rates until Q2 2026, it could temporarily reverse market expectations of rate cuts, leading to significant fluctuations in gold prices. Conversely, if the Fed releases dovish signals, confirming that a rate-cutting cycle is imminent, it will provide strong momentum for gold prices to break through $5,000.
Mainstream institutions generally believe that volatility in the gold market will increase significantly in 2026, but the structural upward trend remains solid. Core driving factors such as inflation hedging demand, escalating global debt pressure, and accelerated de-dollarization remain unchanged, and these long-term factors will continue to support rising gold prices.
- Risk Warning and Disclaimer
- The market involves risk, and trading may not be suitable for all investors. This article is for reference only and does not constitute personal investment advice, nor does it take into account certain users’ specific investment objectives, financial situation, or other needs. Any investment decisions made based on this information are at your own risk.