What game is Wall Street playing? Selling dollars while buying US Treasury bonds – the truth behind the gold price surge.
2026-01-29 20:56:19
On Thursday (January 29), the market exhibited a clear divergence: the US dollar index continued its weakness, briefly approaching its previous lows; while spot gold, driven by safe-haven demand, refreshed its historical high to $5594.82 per ounce before slightly retreating. Meanwhile, the US Treasury market, after experiencing slight pressure in the Asian session, rebounded in the European session, with the 10-year Treasury yield maintaining a slightly bullish trend above 4.25%. The key market clue is that traders are selling the dollar, but not massively selling US assets, particularly US Treasuries. This "sell the dollar, not the Treasuries" logic is profoundly influencing the short-term trajectory of gold and the dollar.

The recent weakness of the US dollar can be partly explained by the US Treasury market. The 10-year Treasury yield has remained around 4.246% on the 240-minute chart, and the MACD indicator's golden cross suggests continued strong short-term momentum. However, a more crucial change has occurred on the yield curve. The well-known institution IFR points out that the spread between the 5-year and 30-year US Treasury yields (5s/30s) has widened again by 7 basis points from last week's low. The market's next focus will be on 106.5 basis points, which is the 50% Fibonacci retracement level of the decline from the January 6 high to the January 23 low.
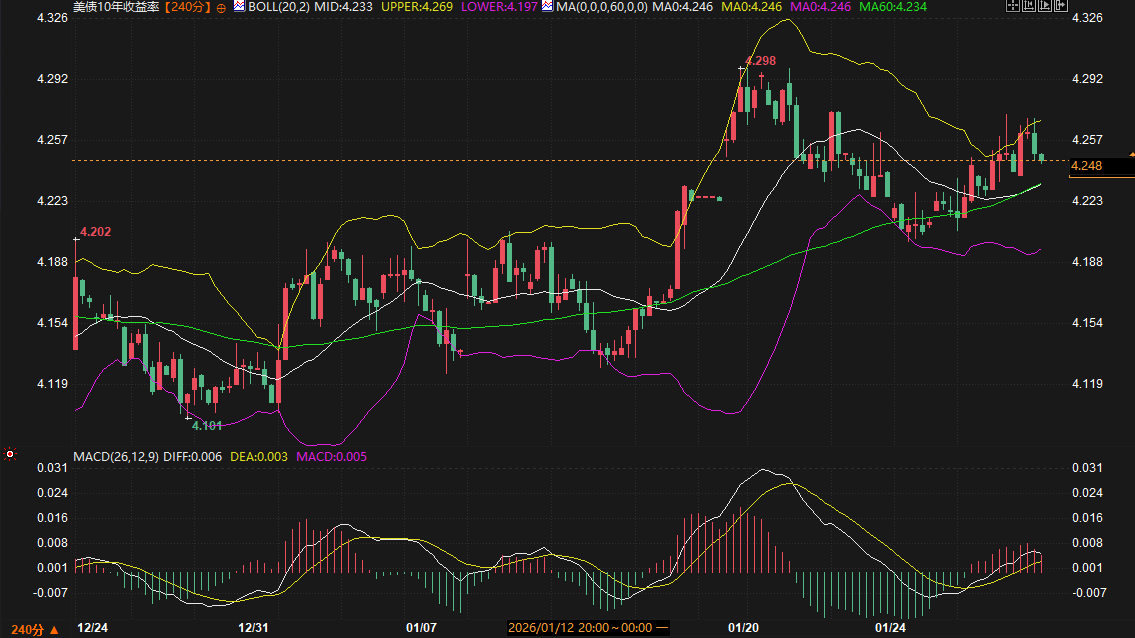
This steepening of the yield curve (i.e., a relative rise in long-term interest rates or a relative fall in short-term interest rates) typically reflects a repricing of market expectations for long-term inflation or economic growth, or concerns about future Treasury supply pressures. Specifically, the 5-year yield touched a recent high of 3.88%, with key resistance in the 3.90%-3.93% range; while the 30-year yield encountered resistance around 4.90%. Rising yields, especially at the long end, should theoretically be attractive to foreign currency investors, but current market behavior shows this has not translated into strong demand for the US dollar. On the contrary, analysts believe that a weaker dollar can reduce US export costs and stimulate the economy in the trade environment, which to some extent aligns with policy objectives. Therefore, the coexistence of stable US Treasury yields and a weakening dollar reveals the core contradiction in the current market: confidence in dollar assets remains, but the preference for the dollar exchange rate has declined.
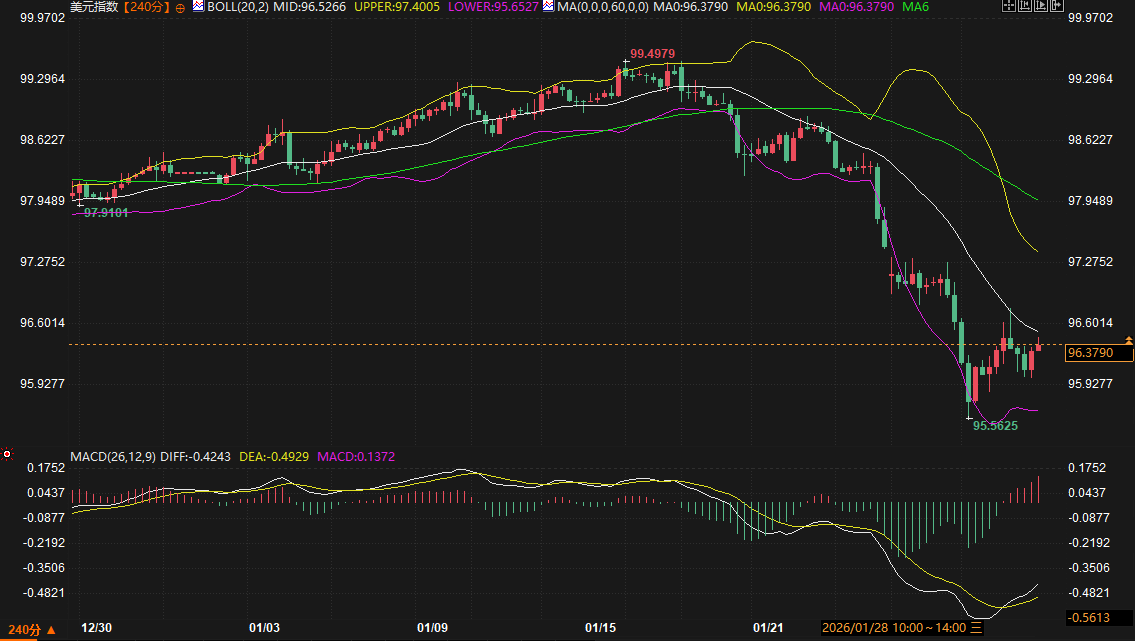
From a technical perspective, the US dollar index has broken below the key support level of 96.3656 on the 240-minute chart. The Bollinger Bands are widening downwards, with the price trading below the middle band (96.5259). The MACD is also below the zero line, indicating a clear short-term downtrend. Intraday, close attention should be paid to whether it can regain a foothold in the 96.40-96.60 area. If it continues to be pressured below this area, the next support level to watch is the 95.50-95.80 range.
The surge in gold prices is currently the most striking phenomenon in the market. Its upward momentum stems partly from the systemic weakening of the US dollar, but more significantly from strong risk aversion. This risk aversion doesn't entirely originate from a loss of confidence in US Treasury bonds, but may also stem from continued anxiety about global geopolitical situations (such as the Russia-Ukraine conflict) and concerns that Trump's tariff rhetoric could trigger a new round of market turmoil. Funds are flowing into assets like gold, considered the ultimate safe haven, despite its far lower liquidity compared to the US dollar.
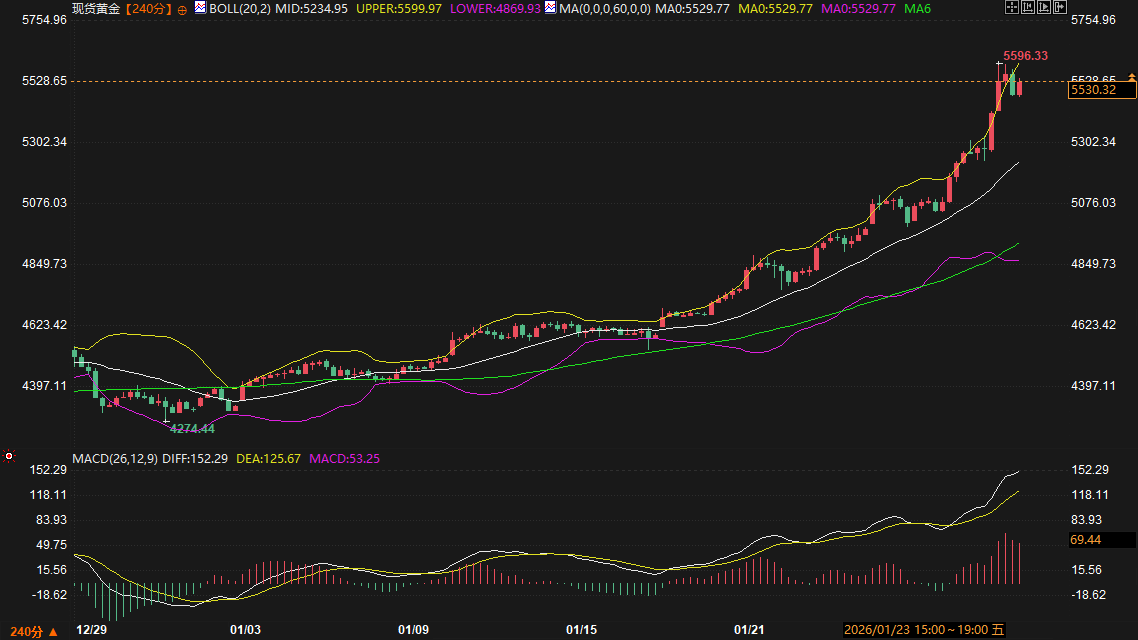
However, the rise in gold prices has entered extreme territory. Some analysts have pointed out that the current surge is "extremely disorderly" and significantly increases the risk of a reversal. Technically, the 240-minute chart for spot gold shows that the price has broken through the upper Bollinger Band ($5600.26), and the MACD indicator has formed a golden cross and is showing a sustained increase in positive value, indicating strong bullish momentum. However, a key risk signal is that the gold price has far exceeded the 20-month upper Bollinger Band ($4812/ounce), a move technically defined as "extreme escalation." Historically, any extreme price movement has been a signal of potential risk. More intriguingly, despite the soaring gold price, net long positions in the futures market have not reached historically high levels, suggesting that this round of buying may be coming from different sources, perhaps more inclined towards medium- to long-term holding (such as central banks or large institutions), rather than purely short-term speculation. Once this buying power subsides, the market will lack follow-up momentum, and the pressure for a technical correction will increase sharply.
Key resistance zone: $5600 - $5650. This area represents the current upper Bollinger Band extension and a psychological psychological level, where gold prices have shown signs of upward pressure followed by a pullback.
Key support zone: First, pay attention to the $5500-$5530 range, which is the consolidation platform and psychological support level during the recent strong upward trend. More important support lies in the $5400-$5430 area, which combines previous highs that have now become support and short-term trend lines.
Key points to watch during trading: Closely monitor gold prices' repeated tests of the $5600 level, and the strength of any pullbacks after each surge. A break below $5500 could indicate a deeper short-term correction.
In summary, the market may enter a critical observation period in the next 2-3 trading days. While the US dollar index's decline is not yet over, a new catalyst is needed for further significant drops. Its performance around the key support zone of 95.50-95.80 warrants close attention; any signs of stabilization and rebound could trigger short-term pullbacks in non-US currencies and gold. Whether the steepening of the US Treasury yield curve continues will be a crucial fundamental factor influencing sentiment towards the US dollar.
For gold, after hitting a record high, market sentiment has become extremely optimistic, which is itself a contrarian indicator. Although the fundamental safe-haven demand remains, the extreme overbought condition on the technical side cannot be ignored. In the short term, gold prices are more likely to enter a period of high-level consolidation, or even undergo a technical correction to digest the recent huge gains. Its trend will be highly dependent on the movement of the US dollar index: if the dollar stops falling and rebounds, gold will face direct profit-taking pressure; if the dollar continues to decline, gold may continue its strength at high levels with sharp fluctuations, but volatility will increase significantly.
In summary, the market is currently in a delicate balance: the "anchor" provided by US Treasury yields is intertwined with the "waves" created by a weak dollar and soaring gold prices. Traders should be wary of the possibility that market sentiment may shift from "concerns about the dollar" to "concerns about gold overheating," which will determine the main direction of fluctuations in the next few trading days.
The steepening of the US Treasury yield curve is putting structural pressure on the US dollar.
The recent weakness of the US dollar can be partly explained by the US Treasury market. The 10-year Treasury yield has remained around 4.246% on the 240-minute chart, and the MACD indicator's golden cross suggests continued strong short-term momentum. However, a more crucial change has occurred on the yield curve. The well-known institution IFR points out that the spread between the 5-year and 30-year US Treasury yields (5s/30s) has widened again by 7 basis points from last week's low. The market's next focus will be on 106.5 basis points, which is the 50% Fibonacci retracement level of the decline from the January 6 high to the January 23 low.
This steepening of the yield curve (i.e., a relative rise in long-term interest rates or a relative fall in short-term interest rates) typically reflects a repricing of market expectations for long-term inflation or economic growth, or concerns about future Treasury supply pressures. Specifically, the 5-year yield touched a recent high of 3.88%, with key resistance in the 3.90%-3.93% range; while the 30-year yield encountered resistance around 4.90%. Rising yields, especially at the long end, should theoretically be attractive to foreign currency investors, but current market behavior shows this has not translated into strong demand for the US dollar. On the contrary, analysts believe that a weaker dollar can reduce US export costs and stimulate the economy in the trade environment, which to some extent aligns with policy objectives. Therefore, the coexistence of stable US Treasury yields and a weakening dollar reveals the core contradiction in the current market: confidence in dollar assets remains, but the preference for the dollar exchange rate has declined.
From a technical perspective, the US dollar index has broken below the key support level of 96.3656 on the 240-minute chart. The Bollinger Bands are widening downwards, with the price trading below the middle band (96.5259). The MACD is also below the zero line, indicating a clear short-term downtrend. Intraday, close attention should be paid to whether it can regain a foothold in the 96.40-96.60 area. If it continues to be pressured below this area, the next support level to watch is the 95.50-95.80 range.
Gold saw strong safe-haven buying, but extreme technical indicators raised concerns about a potential pullback.
The surge in gold prices is currently the most striking phenomenon in the market. Its upward momentum stems partly from the systemic weakening of the US dollar, but more significantly from strong risk aversion. This risk aversion doesn't entirely originate from a loss of confidence in US Treasury bonds, but may also stem from continued anxiety about global geopolitical situations (such as the Russia-Ukraine conflict) and concerns that Trump's tariff rhetoric could trigger a new round of market turmoil. Funds are flowing into assets like gold, considered the ultimate safe haven, despite its far lower liquidity compared to the US dollar.
However, the rise in gold prices has entered extreme territory. Some analysts have pointed out that the current surge is "extremely disorderly" and significantly increases the risk of a reversal. Technically, the 240-minute chart for spot gold shows that the price has broken through the upper Bollinger Band ($5600.26), and the MACD indicator has formed a golden cross and is showing a sustained increase in positive value, indicating strong bullish momentum. However, a key risk signal is that the gold price has far exceeded the 20-month upper Bollinger Band ($4812/ounce), a move technically defined as "extreme escalation." Historically, any extreme price movement has been a signal of potential risk. More intriguingly, despite the soaring gold price, net long positions in the futures market have not reached historically high levels, suggesting that this round of buying may be coming from different sources, perhaps more inclined towards medium- to long-term holding (such as central banks or large institutions), rather than purely short-term speculation. Once this buying power subsides, the market will lack follow-up momentum, and the pressure for a technical correction will increase sharply.
Key resistance zone: $5600 - $5650. This area represents the current upper Bollinger Band extension and a psychological psychological level, where gold prices have shown signs of upward pressure followed by a pullback.
Key support zone: First, pay attention to the $5500-$5530 range, which is the consolidation platform and psychological support level during the recent strong upward trend. More important support lies in the $5400-$5430 area, which combines previous highs that have now become support and short-term trend lines.
Key points to watch during trading: Closely monitor gold prices' repeated tests of the $5600 level, and the strength of any pullbacks after each surge. A break below $5500 could indicate a deeper short-term correction.
Outlook for the next two to three days: Focus on the stabilization of the US dollar and the shift in gold's momentum.
In summary, the market may enter a critical observation period in the next 2-3 trading days. While the US dollar index's decline is not yet over, a new catalyst is needed for further significant drops. Its performance around the key support zone of 95.50-95.80 warrants close attention; any signs of stabilization and rebound could trigger short-term pullbacks in non-US currencies and gold. Whether the steepening of the US Treasury yield curve continues will be a crucial fundamental factor influencing sentiment towards the US dollar.
For gold, after hitting a record high, market sentiment has become extremely optimistic, which is itself a contrarian indicator. Although the fundamental safe-haven demand remains, the extreme overbought condition on the technical side cannot be ignored. In the short term, gold prices are more likely to enter a period of high-level consolidation, or even undergo a technical correction to digest the recent huge gains. Its trend will be highly dependent on the movement of the US dollar index: if the dollar stops falling and rebounds, gold will face direct profit-taking pressure; if the dollar continues to decline, gold may continue its strength at high levels with sharp fluctuations, but volatility will increase significantly.
In summary, the market is currently in a delicate balance: the "anchor" provided by US Treasury yields is intertwined with the "waves" created by a weak dollar and soaring gold prices. Traders should be wary of the possibility that market sentiment may shift from "concerns about the dollar" to "concerns about gold overheating," which will determine the main direction of fluctuations in the next few trading days.
- Risk Warning and Disclaimer
- The market involves risk, and trading may not be suitable for all investors. This article is for reference only and does not constitute personal investment advice, nor does it take into account certain users’ specific investment objectives, financial situation, or other needs. Any investment decisions made based on this information are at your own risk.