Crude oil trading alert: Geopolitical tensions support continued oil price increases, with short-term outlook remaining volatile and upward.
2026-02-04 09:32:21
International crude oil prices continued to rise on Wednesday, trading around $64.12 per barrel, ending Monday's drop of more than 4%. Year-to-date, WTI crude has risen by nearly 10%. The direct catalyst for the oil price rebound was renewed geopolitical tensions.
Market reports indicate that the United States shot down an Iranian drone that approached its aircraft carrier, and an oil tanker involved in a U.S. fuel procurement program encountered several small armed vessels near the Strait of Hormuz, suggesting an increase in maritime risks in the region.

These events have caused the risk premium, which had previously subsided due to expectations of easing tensions, to be re-included in oil prices. However, the upward trend has not fully materialized. The White House stated that President Trump still prefers to handle relations with Iran through diplomatic channels, keeping the market cautious about a full-blown escalation of the situation.
Previously, the US statement that Iran was "seriously negotiating" triggered a sharp drop in oil prices on Monday, demonstrating the market's high sensitivity to news changes. Supply-side factors continue to exert substantial downward pressure on oil prices. Kazakhstan's giant Tengiz oil field, which completely shut down in mid-January, has been gradually restoring production, with daily output recently recovering to nearly 20% of pre-shutdown levels.
Meanwhile, U.S. oil producers are accelerating their recovery following the winter storms, with only about 0.7% of the nation's production currently at a standstill. On the policy front, OPEC+ decided to maintain its crude oil production levels in March, anticipating a gradual recovery in demand over the coming months, with an overall stance leaning towards stability rather than tightening.
Furthermore, global macroeconomic and geopolitical situations continue to intertwine and influence the oil market. Russia's escalating airstrikes against Ukraine have brought energy infrastructure risks back into the market spotlight; while the new trade agreement reached between the United States and India has been interpreted by some institutions as potentially affecting the maritime flow of Russian crude oil, further increasing market uncertainty regarding changes in the supply and demand structure.
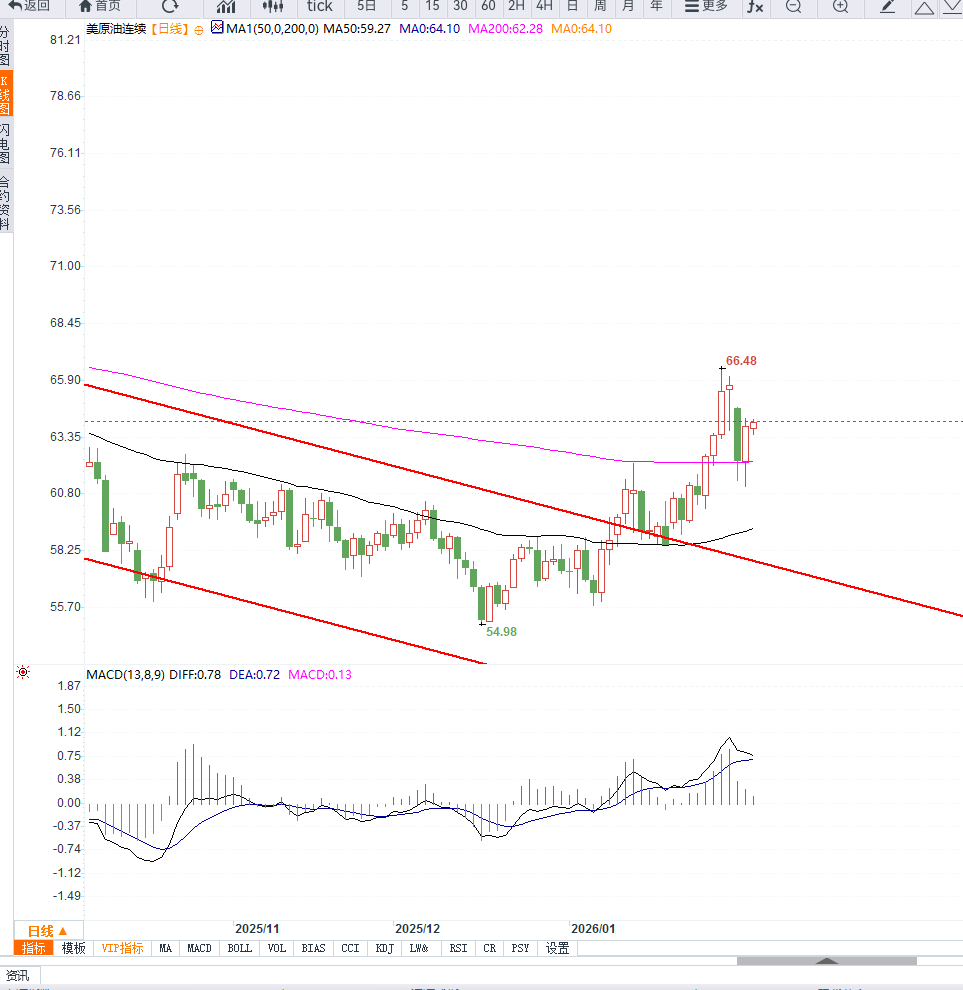
From a daily chart perspective, WTI crude oil found significant support around $61 after a sharp decline in the previous trading day, and subsequently rebounded on Tuesday. The price regained the $63 level, indicating that buying interest at lower levels has begun to emerge, and short-term selling pressure has been somewhat alleviated.
The moving average system shows that WTI is currently trading in the area where short-term and medium-term moving averages intersect. The 9-day moving average has flattened out after a rapid decline, reflecting a shift in short-term momentum from a one-sided downward trend to consolidation; the 50-day moving average is around $62, providing important technical support below the current price.
Historically, this moving average has served as a support level during numerous corrections. If prices can continue to hold this area, the medium-term structure on the daily chart is likely to remain stable. Conversely, if prices break below and close below the 50-day moving average, oil prices may retest $61 or even lower.
From a technical perspective, WTI crude oil is still trading within a range. The previous rapid decline did not break the overall range structure, and the current rise is more of a technical correction towards the lower end of the range.
The current $64-$65 area constitutes a significant resistance zone for any short-term rebound. This area is both a previous zone of concentrated trading and a key location where bulls and bears have repeatedly clashed. Without sustained positive catalysts, the possibility of oil prices encountering resistance and falling back within this range remains.
In terms of momentum indicators, the daily RSI rebounded after approaching the oversold zone, but remains within the neutral range and has not yet released a signal of a trend reversal. This suggests that the current rebound is driven more by sentiment and changes in risk premiums than by fundamentals or trend forces.
If the RSI fails to enter a strong zone, the upside potential for oil prices may be significantly limited. Overall, the WTI daily chart shows a typical pattern of "support below and resistance above." The $61-$62 range constitutes a crucial short-term support zone, while the $64-$66 range will determine whether the rebound can extend further.
Amid frequent geopolitical disturbances, oil prices may remain volatile in the short term, but the daily chart suggests a more volatile consolidation rather than a one-sided trend.
Editor's Note:
The core contradiction in the current crude oil market is not simply geopolitical risk or supply changes, but rather the emotional pricing resulting from the ongoing tug-of-war between the two. The WTI rebound is more of a temporary recovery in risk premiums, while the gradual restoration of supply limits the upside potential.
Amidst fluctuating diplomatic signals and geopolitical tensions, oil prices are expected to remain highly volatile in the short term. For the market, the $63 level is not only a price watershed but also a crucial point to observe whether risk sentiment can be sustained.
Market reports indicate that the United States shot down an Iranian drone that approached its aircraft carrier, and an oil tanker involved in a U.S. fuel procurement program encountered several small armed vessels near the Strait of Hormuz, suggesting an increase in maritime risks in the region.
These events have caused the risk premium, which had previously subsided due to expectations of easing tensions, to be re-included in oil prices. However, the upward trend has not fully materialized. The White House stated that President Trump still prefers to handle relations with Iran through diplomatic channels, keeping the market cautious about a full-blown escalation of the situation.
Previously, the US statement that Iran was "seriously negotiating" triggered a sharp drop in oil prices on Monday, demonstrating the market's high sensitivity to news changes. Supply-side factors continue to exert substantial downward pressure on oil prices. Kazakhstan's giant Tengiz oil field, which completely shut down in mid-January, has been gradually restoring production, with daily output recently recovering to nearly 20% of pre-shutdown levels.
Meanwhile, U.S. oil producers are accelerating their recovery following the winter storms, with only about 0.7% of the nation's production currently at a standstill. On the policy front, OPEC+ decided to maintain its crude oil production levels in March, anticipating a gradual recovery in demand over the coming months, with an overall stance leaning towards stability rather than tightening.
Furthermore, global macroeconomic and geopolitical situations continue to intertwine and influence the oil market. Russia's escalating airstrikes against Ukraine have brought energy infrastructure risks back into the market spotlight; while the new trade agreement reached between the United States and India has been interpreted by some institutions as potentially affecting the maritime flow of Russian crude oil, further increasing market uncertainty regarding changes in the supply and demand structure.
From a daily chart perspective, WTI crude oil found significant support around $61 after a sharp decline in the previous trading day, and subsequently rebounded on Tuesday. The price regained the $63 level, indicating that buying interest at lower levels has begun to emerge, and short-term selling pressure has been somewhat alleviated.
The moving average system shows that WTI is currently trading in the area where short-term and medium-term moving averages intersect. The 9-day moving average has flattened out after a rapid decline, reflecting a shift in short-term momentum from a one-sided downward trend to consolidation; the 50-day moving average is around $62, providing important technical support below the current price.
Historically, this moving average has served as a support level during numerous corrections. If prices can continue to hold this area, the medium-term structure on the daily chart is likely to remain stable. Conversely, if prices break below and close below the 50-day moving average, oil prices may retest $61 or even lower.
From a technical perspective, WTI crude oil is still trading within a range. The previous rapid decline did not break the overall range structure, and the current rise is more of a technical correction towards the lower end of the range.
The current $64-$65 area constitutes a significant resistance zone for any short-term rebound. This area is both a previous zone of concentrated trading and a key location where bulls and bears have repeatedly clashed. Without sustained positive catalysts, the possibility of oil prices encountering resistance and falling back within this range remains.
In terms of momentum indicators, the daily RSI rebounded after approaching the oversold zone, but remains within the neutral range and has not yet released a signal of a trend reversal. This suggests that the current rebound is driven more by sentiment and changes in risk premiums than by fundamentals or trend forces.
If the RSI fails to enter a strong zone, the upside potential for oil prices may be significantly limited. Overall, the WTI daily chart shows a typical pattern of "support below and resistance above." The $61-$62 range constitutes a crucial short-term support zone, while the $64-$66 range will determine whether the rebound can extend further.
Amid frequent geopolitical disturbances, oil prices may remain volatile in the short term, but the daily chart suggests a more volatile consolidation rather than a one-sided trend.
Editor's Note:
The core contradiction in the current crude oil market is not simply geopolitical risk or supply changes, but rather the emotional pricing resulting from the ongoing tug-of-war between the two. The WTI rebound is more of a temporary recovery in risk premiums, while the gradual restoration of supply limits the upside potential.
Amidst fluctuating diplomatic signals and geopolitical tensions, oil prices are expected to remain highly volatile in the short term. For the market, the $63 level is not only a price watershed but also a crucial point to observe whether risk sentiment can be sustained.
- Risk Warning and Disclaimer
- The market involves risk, and trading may not be suitable for all investors. This article is for reference only and does not constitute personal investment advice, nor does it take into account certain users’ specific investment objectives, financial situation, or other needs. Any investment decisions made based on this information are at your own risk.