Markets cool down, trading returns to the underlying logic of US inflation.
2026-02-06 21:58:06
As US inflation surpasses the Federal Reserve's 2% target for the fifth consecutive year, it is highly likely that the US inflation rate for the whole of 2026 will continue to remain high at around 3%.
A tight labor market, strong consumer spending, and the gradual transmission of tariff costs, coupled with the significant lag in housing inflation indicators, are the core factors contributing to the persistent stickiness of inflation.
Recent market activity has shown signs of a marginal easing of inflation, particularly with a slowdown in the price increases of core services and motor vehicles.
However, this does not mean that deflationary trends will continue to develop in 2026, and the difficulty of monitoring inflation has increased significantly at the current stage.
Data distortion and collection interruptions, significant uncertainties in tariff policies, and economic structural adjustments caused by demographic changes have all brought multiple disturbances to the assessment of inflation trends and the interpretation of actual data. Currently, the market seems to have ended its one-sided trend. To seize the trading opportunities brought by inflation, it is necessary to study how to observe inflation effectively and avoid data misinterpretation.
The 2025 US federal government shutdown directly disrupted the regular collection of inflation data. October's monthly core inflation data was basically missing, while November's data was collected within a compressed time window.
The continued distortion of data makes it difficult for the market to make a highly certain trend judgment on month-on-month inflation data.
The Owner Equivalent Rent (OER) indicator in the Consumer Price Index (CPI), which was highlighted in previous articles, continues to distort the true trend of inflation (due to missing data collection, a very low figure has been used for three consecutive months). This indicator has too high a weight in the CPI basket of components, but its impact on the core Personal Consumption Expenditures (PCE) index, which is favored by the Federal Reserve, is relatively limited.
Considering the multiple disruptive factors affecting the current inflation trend, this article will clarify the core monitoring logic and key dimensions of US inflation data in the coming months.
For most of 2024, core commodity inflation showed a deflationary trend, but prices in this sector began to rise after tariffs were introduced.
As supply chains and market demand gradually return to normal, the window of opportunity for a sharp drop in commodity prices has largely closed. Before tariff policies are implemented, core commodity inflation will rise moderately in 2025, with a year-on-year increase of less than 1%.
After factoring in the impact of tariff policies, it is estimated that the contribution of core commodities to the year-on-year increase in core CPI will increase by 0.3 percentage points in the third quarter of 2025, a figure far higher than the normal level before the COVID-19 pandemic.
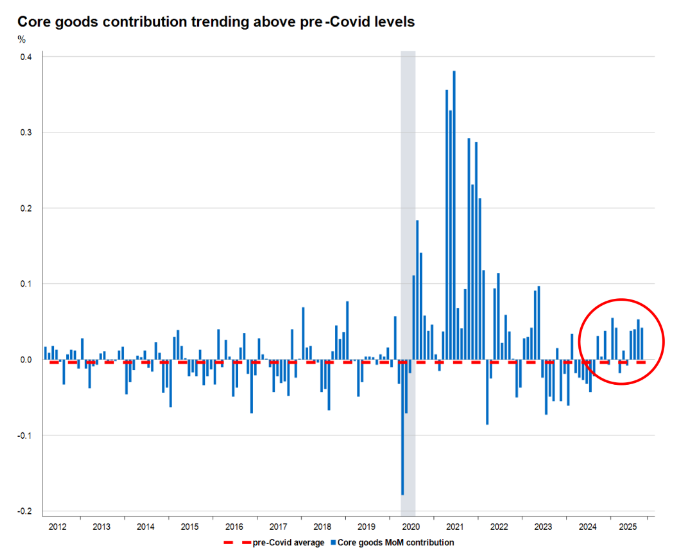
(Beyond the pandemic period)
What worries the market is that the transmission effect of tariffs on final consumer prices has not yet been fully realized, and this transmission effect is expected to peak in the second quarter of 2026.
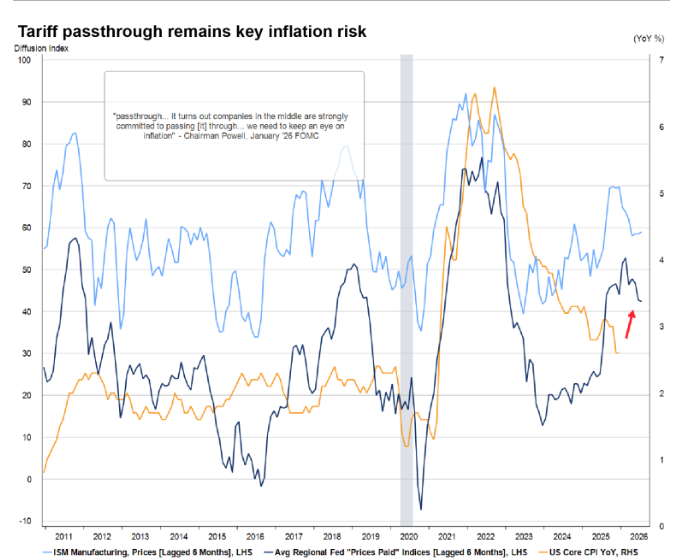
Whether it's the survey data from the Institute for Supply Management (ISM), the National Federation of Independent Business (NFIB), or the business survey results from various regional Federal Reserve Banks, they all reflect significant upward pressure on prices, and the trend of this data is completely different from the official CPI data.
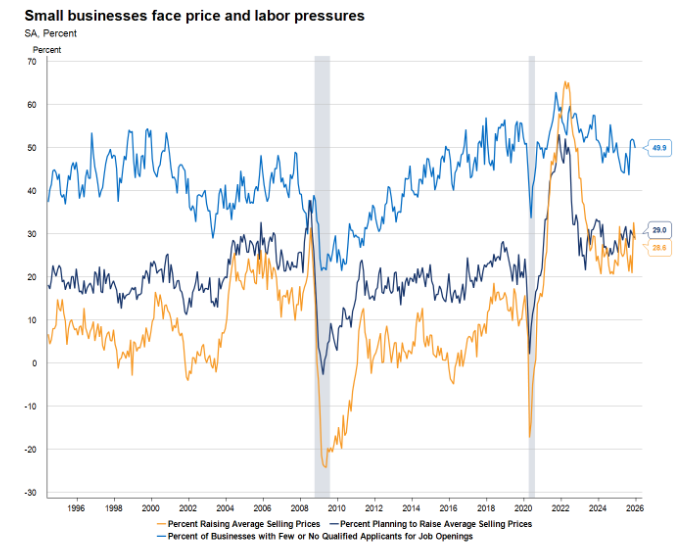
(Small businesses face price and cost pressures far greater than average)
In fact, the NFIB's small business survey revealed three main issues among the high percentage of businesses: first, they have already raised product prices; second, they plan to continue raising prices; and third, even with the recent weak market performance, businesses are still struggling to recruit qualified workers.
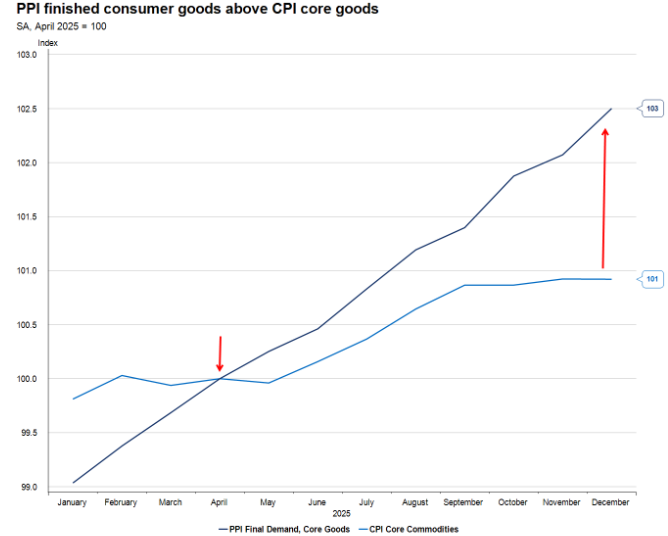
Of particular note is that the Producer Price Index (PPI) for December 2025 shows that the price pressure from tariffs is still being transmitted through the supply chain and will continue to push up end-consumer prices in 2026. This is one of the reasons why Maxine Waters recently made a memorable scene in the House Financial Services Committee, yelling at the committee chairman, "Can you shut him up?"
While the rise in PPI in December was mainly driven by the service sector, the market should not misinterpret this signal: the core driver of this PPI surge was the price increase in the wholesale trade of machinery and equipment.
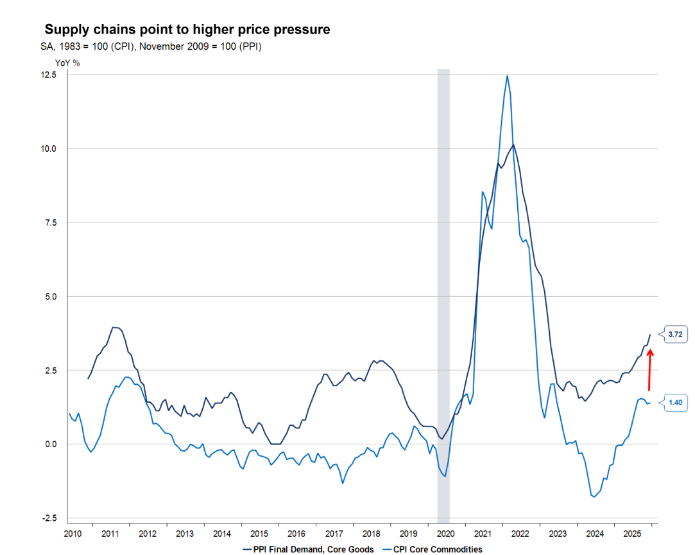
(PPI leading indicator of inflation)
This data clearly shows that tariff pressure is gradually being transmitted along the supply chain and will continue to penetrate into the final production stage in the first half of 2026, and will eventually be completely passed on to consumers.
(Leading indicators such as PPI and wages have already demonstrated the impact of tariffs on inflation.)
The core obstacle to inflation returning to the Fed’s 2% target is core services inflation, which excludes housing—a figure whose year-on-year growth has never turned negative in the past 40 years.
In short, this sector will not experience substantial deflationary pressure, and more importantly, the extent of deflation will be extremely limited.
Inflation trends in this sector are highly dependent on wage levels, as the service industry is a typical labor-intensive sector.
Given the continued tightness of the labor market and the difficulty in significantly lowering wage levels, there is no basis for a substantial decline in core services inflation excluding housing.
It needs to be made clear that the high inflation in the service sector is largely due to the tight labor market.
In terms of the share of gross value added (GVA), that is, the contribution of each sector to GDP, employee compensation accounts for 49% of input costs in the service industry, while the share is 46% in the goods industry.
The trade, transportation, and warehousing industries, with their meager profit margins, are particularly affected by tariff pressures, with the impact on them being almost seven times greater than that on the overall goods and services industry.
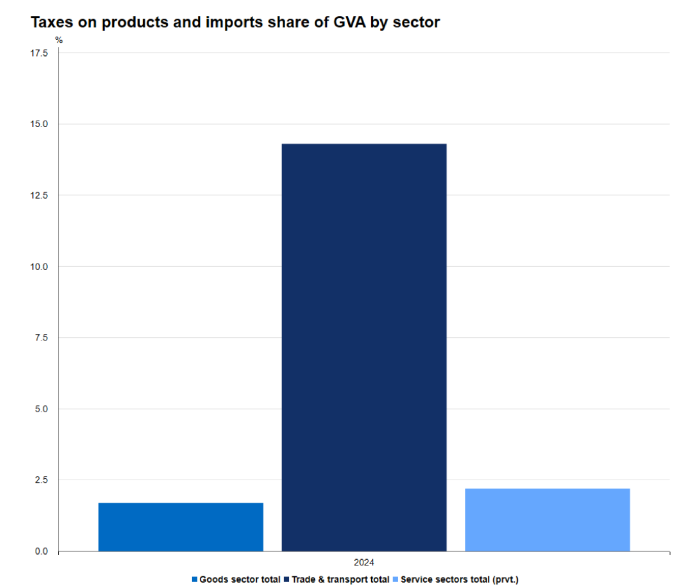
(Trade and transportation sectors suffered 7 times more damage)
The pressure on profit margins in this industry, as reflected in the December 2025 PPI report, is not an isolated case.
This data also means that the transmission effect of tariffs is gradually approaching end consumers along the supply chain.
(PPI drives commodity inflation)
Looking back at April 2025, commodity prices did not immediately surge, primarily because companies postponed the cost of paying tariffs by increasing inventory.
Another important reason why many consumer-facing companies are unwilling to pass on significant tariff burdens is to maintain their existing market share.
This prediction has been validated: consumer spending during the 2025 holiday shopping season was very strong, and the market anticipated that goods would be more expensive afterward, so they chose to stock up in advance before the effects of tariffs became apparent.
The reason is actually quite simple: the difference between spot and forward freight rates indicates that importers and exporters are scrambling to import and export, while manufacturers are experiencing increased revenue but not increased profit, with gross profit margins shrinking rapidly.
The housing inflation indicator (OER) in the CPI lags significantly behind the actual trend of the real estate market, with an estimated lag time of nearly two years.
From this perspective, the trend of OER in the coming year is basically predictable, because the market has fully grasped the actual operating rules of housing prices in the past.
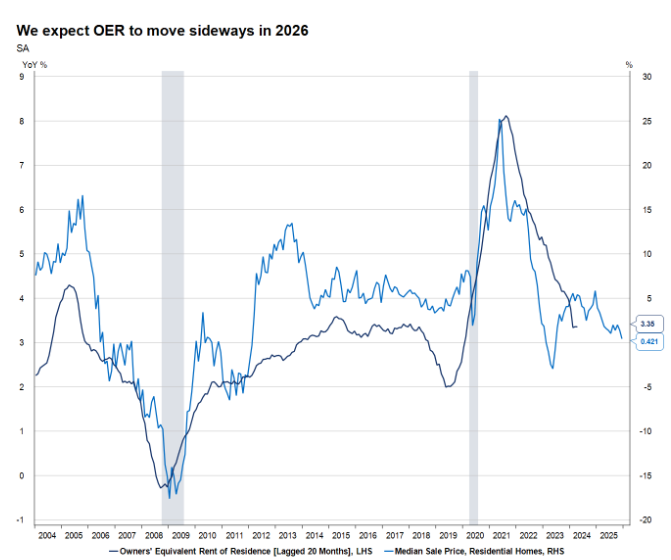
(House prices lead rents)
In other words, a significant decline in OER is most likely to occur in 2027. However, due to the statistical calculation method of OER, it can only be roughly estimated, especially since relevant data for October 2025 is missing.
The way the U.S. Bureau of Labor Statistics corrects for this missing data in October 2025 may lead to an unexpected drop in the OER index.
Another important factor contributing to the relatively moderate CPI trend in 2026 is the adjustment of the weighting of the CPI basket of goods. The weighting of housing-related indicators is expected to increase, while the weighting of commodity-related indicators will decrease accordingly. This is an important detail because housing prices are falling.
On the surface, this adjustment is beneficial to the CPI trend, but its impact on the Federal Reserve's preferred inflation indicator, Personal Consumption Expenditures (PCE), is negligible.
More importantly, the adjustment of indicator weights does not represent a substantial deflationary trend and cannot change the core operating logic of inflation.
(Inflation in the service sector is unlikely to decrease)
In fact, this weighting adjustment may ultimately have an adverse impact on the CPI trend, because the statistics of some indicators are inherently lagging, with auto insurance being a typical example. Auto insurance prices have shown a catch-up trend in CPI statistics. If tariffs further push up car prices, auto insurance prices will also rise in tandem, and the weight of auto insurance in the CPI will be further increased in 2026.
Paying closer attention to industry sectors that directly impact consumer budgets reveals that the more frequently purchased goods and services tend to have a more significant impact on consumer confidence and inflation perception.
The University of Michigan Consumer Sentiment Index shows a much stronger correlation with gasoline prices than with the prices of any other goods or services. This is primarily because gasoline prices are readily available and are a frequently purchased item for consumers.
Based on this, price trends in energy, food, and other non-durable goods can be closely monitored to determine potential changes in consumer behavior.
(Repeat consumption goods determine the confidence index)
It is important to note that the elimination of Medicare subsidies under the Affordable Care Act (ACA) will inevitably increase the budget burden on consumers, but this factor is not included in the CPI statistics—the CPI system does not include goods and services with income thresholds.
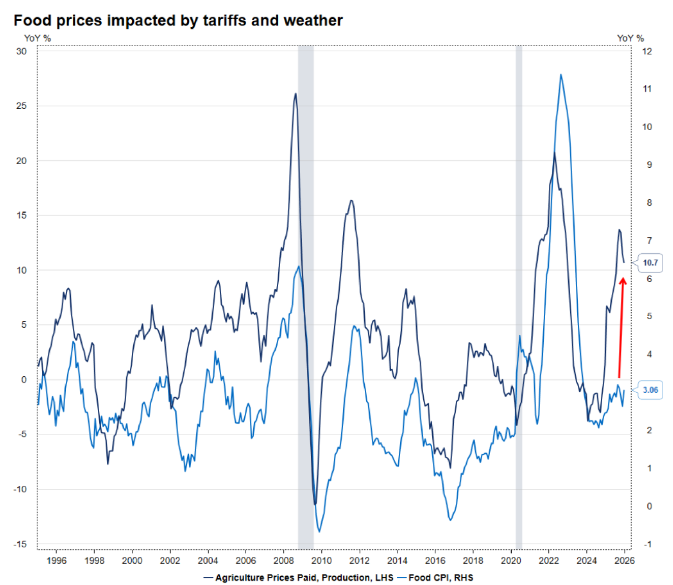
Price movements outside the core inflation basket have shown worrying signs.
In recent months, the prices of agricultural inputs for farmers have continued to rise, and this cost pressure is only just beginning to be passed on to end-product food prices.
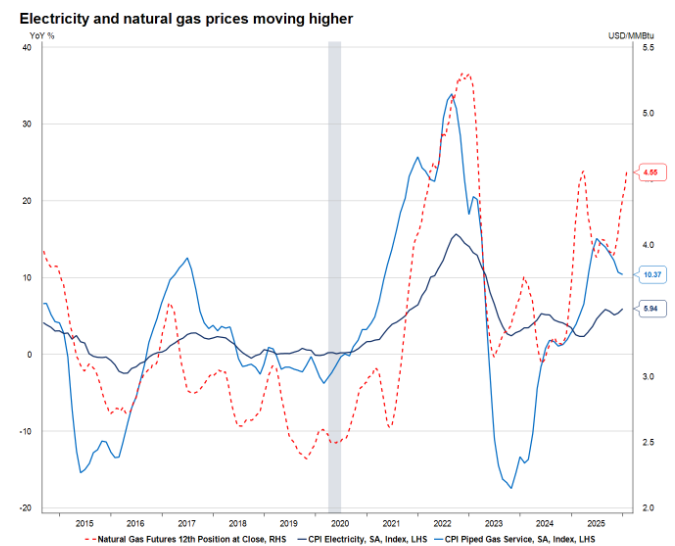
Energy prices fluctuate wildly due to geopolitical events and weather factors, all of which are beyond the Federal Reserve's control.
Nevertheless, it still deserves close attention from the market because such prices directly affect consumers' actual budgets.
According to the 2024 Consumer Expenditure Survey, spending on food, utilities, and gasoline combined accounts for nearly 25% of consumers' total budget.
What the market needs to understand is that the Federal Reserve will monitor inflationary pressures through multiple channels and sources, including CPI, PCE, import and export price indices, and wage data.
However, the inflation-related indicator that it publicly stated it favored, especially by the Federal Reserve, was still the core personal consumption expenditures index (PCE).
Throughout 2025, the trends of core PCE inflation and core CPI were largely similar, but for most of 2025, the year-on-year increase in core CPI was consistently higher than that of core PCE.
The difference in their trends mainly stems from differences in statistical scope, weighting, calculation methods, covered population, and data sources.
For example, the CPI does not include healthcare costs paid by employers for their employees; housing has a significantly higher weighting in the CPI;
Simply put, the CPI uses a fixed basket of goods to calculate inflation, while the PCE fully considers the substitution effect among consumers.
The CPI only covers urban consumers, while the PCE covers all consumers. The CPI is an important input for estimating many of the PCE's sub-items, but the estimation of some sub-items also uses other data sources such as the Producer Price Index (PPI).
Nevertheless, the November 2025 report shows that core PCE inflation remains at 2.8%, well above the Federal Reserve's 2% target.
Recent CPI data may indicate that inflation still has room to fall, but if the market overemphasizes this short-term trend, it may make incorrect judgments.
On the one hand, the CPI gives a higher weight to the housing sector, which is the main driver of the weakening CPI in 2025, but this trend will continue to be tracked in 2026;
On the other hand, the Federal Reserve's preferred PCE indicator will not be affected by the statistical methodology adjustment at the beginning of the year, while the CPI will complete the weighting adjustment in the January 2026 report, which is expected to further increase the weight of the housing sector in the CPI, thereby distorting the actual trend of inflation.
This means that, compared to core PCE, core CPI may be sending a false signal to the market that inflation is declining.
In fact, since 1960, in 791 monthly statistics, the year-on-year increase of core CPI has been lower than that of core PCE in only 20% of cases, or only 160 times.
Because the CPI index has increased the proportion of housing prices, and the rise in housing prices in the United States has continued to slow down, and existing home sales are also dismal, the CPI will appear to be under control due to the impact of housing, while the PCE does not take housing into account at all.
Therefore, we can boldly infer that as the transmission effect of tariffs is basically released and inflationary pressure on core commodities continues to rise, the core CPI inflation rate will reach a peak of 3% in the second quarter of 2026. In other words, the CPI cannot give us a signal in advance that inflation is under control and interest rates can be cut. Ultimately, we still need to judge through the core PCE.
However, considering the various data distortions and statistical adjustments mentioned above, predicting inflation in the current environment requires setting a wider confidence interval than usual to address potential trend deviations.
A tight labor market, strong consumer spending, and the gradual transmission of tariff costs, coupled with the significant lag in housing inflation indicators, are the core factors contributing to the persistent stickiness of inflation.
Recent market activity has shown signs of a marginal easing of inflation, particularly with a slowdown in the price increases of core services and motor vehicles.
However, this does not mean that deflationary trends will continue to develop in 2026, and the difficulty of monitoring inflation has increased significantly at the current stage.
Data distortion and collection interruptions, significant uncertainties in tariff policies, and economic structural adjustments caused by demographic changes have all brought multiple disturbances to the assessment of inflation trends and the interpretation of actual data. Currently, the market seems to have ended its one-sided trend. To seize the trading opportunities brought by inflation, it is necessary to study how to observe inflation effectively and avoid data misinterpretation.
The 2025 US federal government shutdown directly disrupted the regular collection of inflation data. October's monthly core inflation data was basically missing, while November's data was collected within a compressed time window.
The continued distortion of data makes it difficult for the market to make a highly certain trend judgment on month-on-month inflation data.
The Owner Equivalent Rent (OER) indicator in the Consumer Price Index (CPI), which was highlighted in previous articles, continues to distort the true trend of inflation (due to missing data collection, a very low figure has been used for three consecutive months). This indicator has too high a weight in the CPI basket of components, but its impact on the core Personal Consumption Expenditures (PCE) index, which is favored by the Federal Reserve, is relatively limited.
Considering the multiple disruptive factors affecting the current inflation trend, this article will clarify the core monitoring logic and key dimensions of US inflation data in the coming months.
Tariffs further drive up commodity inflation, which was already on an upward trend.
For most of 2024, core commodity inflation showed a deflationary trend, but prices in this sector began to rise after tariffs were introduced.
As supply chains and market demand gradually return to normal, the window of opportunity for a sharp drop in commodity prices has largely closed. Before tariff policies are implemented, core commodity inflation will rise moderately in 2025, with a year-on-year increase of less than 1%.
After factoring in the impact of tariff policies, it is estimated that the contribution of core commodities to the year-on-year increase in core CPI will increase by 0.3 percentage points in the third quarter of 2025, a figure far higher than the normal level before the COVID-19 pandemic.
(Beyond the pandemic period)
What worries the market is that the transmission effect of tariffs on final consumer prices has not yet been fully realized, and this transmission effect is expected to peak in the second quarter of 2026.
Whether it's the survey data from the Institute for Supply Management (ISM), the National Federation of Independent Business (NFIB), or the business survey results from various regional Federal Reserve Banks, they all reflect significant upward pressure on prices, and the trend of this data is completely different from the official CPI data.
(Small businesses face price and cost pressures far greater than average)
In fact, the NFIB's small business survey revealed three main issues among the high percentage of businesses: first, they have already raised product prices; second, they plan to continue raising prices; and third, even with the recent weak market performance, businesses are still struggling to recruit qualified workers.
Of particular note is that the Producer Price Index (PPI) for December 2025 shows that the price pressure from tariffs is still being transmitted through the supply chain and will continue to push up end-consumer prices in 2026. This is one of the reasons why Maxine Waters recently made a memorable scene in the House Financial Services Committee, yelling at the committee chairman, "Can you shut him up?"
While the rise in PPI in December was mainly driven by the service sector, the market should not misinterpret this signal: the core driver of this PPI surge was the price increase in the wholesale trade of machinery and equipment.
(PPI leading indicator of inflation)
This data clearly shows that tariff pressure is gradually being transmitted along the supply chain and will continue to penetrate into the final production stage in the first half of 2026, and will eventually be completely passed on to consumers.
(Leading indicators such as PPI and wages have already demonstrated the impact of tariffs on inflation.)
Excluding core housing services, they remain the largest contributor to rising inflation.
The core obstacle to inflation returning to the Fed’s 2% target is core services inflation, which excludes housing—a figure whose year-on-year growth has never turned negative in the past 40 years.
In short, this sector will not experience substantial deflationary pressure, and more importantly, the extent of deflation will be extremely limited.
Inflation trends in this sector are highly dependent on wage levels, as the service industry is a typical labor-intensive sector.
Given the continued tightness of the labor market and the difficulty in significantly lowering wage levels, there is no basis for a substantial decline in core services inflation excluding housing.
It needs to be made clear that the high inflation in the service sector is largely due to the tight labor market.
In terms of the share of gross value added (GVA), that is, the contribution of each sector to GDP, employee compensation accounts for 49% of input costs in the service industry, while the share is 46% in the goods industry.
The trade, transportation, and warehousing industries, with their meager profit margins, are particularly affected by tariff pressures, with the impact on them being almost seven times greater than that on the overall goods and services industry.
(Trade and transportation sectors suffered 7 times more damage)
The pressure on profit margins in this industry, as reflected in the December 2025 PPI report, is not an isolated case.
This data also means that the transmission effect of tariffs is gradually approaching end consumers along the supply chain.
(PPI drives commodity inflation)
Looking back at April 2025, commodity prices did not immediately surge, primarily because companies postponed the cost of paying tariffs by increasing inventory.
Another important reason why many consumer-facing companies are unwilling to pass on significant tariff burdens is to maintain their existing market share.
This prediction has been validated: consumer spending during the 2025 holiday shopping season was very strong, and the market anticipated that goods would be more expensive afterward, so they chose to stock up in advance before the effects of tariffs became apparent.
The reason is actually quite simple: the difference between spot and forward freight rates indicates that importers and exporters are scrambling to import and export, while manufacturers are experiencing increased revenue but not increased profit, with gross profit margins shrinking rapidly.
Housing inflation: a dual consequence of lagging changes and flaws in statistical methodology
The housing inflation indicator (OER) in the CPI lags significantly behind the actual trend of the real estate market, with an estimated lag time of nearly two years.
From this perspective, the trend of OER in the coming year is basically predictable, because the market has fully grasped the actual operating rules of housing prices in the past.
(House prices lead rents)
In other words, a significant decline in OER is most likely to occur in 2027. However, due to the statistical calculation method of OER, it can only be roughly estimated, especially since relevant data for October 2025 is missing.
The way the U.S. Bureau of Labor Statistics corrects for this missing data in October 2025 may lead to an unexpected drop in the OER index.
Another important factor contributing to the relatively moderate CPI trend in 2026 is the adjustment of the weighting of the CPI basket of goods. The weighting of housing-related indicators is expected to increase, while the weighting of commodity-related indicators will decrease accordingly. This is an important detail because housing prices are falling.
On the surface, this adjustment is beneficial to the CPI trend, but its impact on the Federal Reserve's preferred inflation indicator, Personal Consumption Expenditures (PCE), is negligible.
More importantly, the adjustment of indicator weights does not represent a substantial deflationary trend and cannot change the core operating logic of inflation.
(Inflation in the service sector is unlikely to decrease)
In fact, this weighting adjustment may ultimately have an adverse impact on the CPI trend, because the statistics of some indicators are inherently lagging, with auto insurance being a typical example. Auto insurance prices have shown a catch-up trend in CPI statistics. If tariffs further push up car prices, auto insurance prices will also rise in tandem, and the weight of auto insurance in the CPI will be further increased in 2026.
Price increases outside the core basket may suppress consumer demand.
Paying closer attention to industry sectors that directly impact consumer budgets reveals that the more frequently purchased goods and services tend to have a more significant impact on consumer confidence and inflation perception.
The University of Michigan Consumer Sentiment Index shows a much stronger correlation with gasoline prices than with the prices of any other goods or services. This is primarily because gasoline prices are readily available and are a frequently purchased item for consumers.
Based on this, price trends in energy, food, and other non-durable goods can be closely monitored to determine potential changes in consumer behavior.
(Repeat consumption goods determine the confidence index)
It is important to note that the elimination of Medicare subsidies under the Affordable Care Act (ACA) will inevitably increase the budget burden on consumers, but this factor is not included in the CPI statistics—the CPI system does not include goods and services with income thresholds.
Price movements outside the core inflation basket have shown worrying signs.
In recent months, the prices of agricultural inputs for farmers have continued to rise, and this cost pressure is only just beginning to be passed on to end-product food prices.
Energy prices fluctuate wildly due to geopolitical events and weather factors, all of which are beyond the Federal Reserve's control.
Nevertheless, it still deserves close attention from the market because such prices directly affect consumers' actual budgets.
According to the 2024 Consumer Expenditure Survey, spending on food, utilities, and gasoline combined accounts for nearly 25% of consumers' total budget.
What inflation indicators does the Federal Reserve focus on? What implications do they have for interest rate policy in 2026?
What the market needs to understand is that the Federal Reserve will monitor inflationary pressures through multiple channels and sources, including CPI, PCE, import and export price indices, and wage data.
However, the inflation-related indicator that it publicly stated it favored, especially by the Federal Reserve, was still the core personal consumption expenditures index (PCE).
Throughout 2025, the trends of core PCE inflation and core CPI were largely similar, but for most of 2025, the year-on-year increase in core CPI was consistently higher than that of core PCE.
The difference in their trends mainly stems from differences in statistical scope, weighting, calculation methods, covered population, and data sources.
For example, the CPI does not include healthcare costs paid by employers for their employees; housing has a significantly higher weighting in the CPI;
Simply put, the CPI uses a fixed basket of goods to calculate inflation, while the PCE fully considers the substitution effect among consumers.
The CPI only covers urban consumers, while the PCE covers all consumers. The CPI is an important input for estimating many of the PCE's sub-items, but the estimation of some sub-items also uses other data sources such as the Producer Price Index (PPI).
Nevertheless, the November 2025 report shows that core PCE inflation remains at 2.8%, well above the Federal Reserve's 2% target.
Recent CPI data may indicate that inflation still has room to fall, but if the market overemphasizes this short-term trend, it may make incorrect judgments.
On the one hand, the CPI gives a higher weight to the housing sector, which is the main driver of the weakening CPI in 2025, but this trend will continue to be tracked in 2026;
On the other hand, the Federal Reserve's preferred PCE indicator will not be affected by the statistical methodology adjustment at the beginning of the year, while the CPI will complete the weighting adjustment in the January 2026 report, which is expected to further increase the weight of the housing sector in the CPI, thereby distorting the actual trend of inflation.
This means that, compared to core PCE, core CPI may be sending a false signal to the market that inflation is declining.
In fact, since 1960, in 791 monthly statistics, the year-on-year increase of core CPI has been lower than that of core PCE in only 20% of cases, or only 160 times.
Summarize:
Because the CPI index has increased the proportion of housing prices, and the rise in housing prices in the United States has continued to slow down, and existing home sales are also dismal, the CPI will appear to be under control due to the impact of housing, while the PCE does not take housing into account at all.
Therefore, we can boldly infer that as the transmission effect of tariffs is basically released and inflationary pressure on core commodities continues to rise, the core CPI inflation rate will reach a peak of 3% in the second quarter of 2026. In other words, the CPI cannot give us a signal in advance that inflation is under control and interest rates can be cut. Ultimately, we still need to judge through the core PCE.
However, considering the various data distortions and statistical adjustments mentioned above, predicting inflation in the current environment requires setting a wider confidence interval than usual to address potential trend deviations.
- Risk Warning and Disclaimer
- The market involves risk, and trading may not be suitable for all investors. This article is for reference only and does not constitute personal investment advice, nor does it take into account certain users’ specific investment objectives, financial situation, or other needs. Any investment decisions made based on this information are at your own risk.