Gold prices stalled shortly after breaking through $5,000? Two forces are fiercely battling behind the scenes; what should we pay attention to?
2026-02-09 19:16:02
On Monday (February 9), spot gold consolidated at high levels after a strong rally last Friday. It briefly held above the psychological level of $5,000/ounce in early European trading, but gains subsequently narrowed. This article will analyze the bullish and bearish logic of gold prices ahead of key US economic data releases, combining the latest market dynamics and the 4-hour chart technical structure, and provide a short-term outlook.

At the start of the week, the gold market continued the strong momentum from last Friday. Against the backdrop of a weakening dollar, spot gold prices rose above $5012 per ounce in early European trading on Monday, attempting to solidify its breakout above the $5000 level. However, once the European session began, the upward momentum failed to continue, and prices retreated from their highs, with the latest quote falling back below $5000, indicating a significant divergence between bulls and bears near this important psychological and technical level.
The market's focus has now shifted entirely to the upcoming US January non-farm payrolls report, Consumer Price Index (CPI), and initial jobless claims data, all to be released this week. These figures will be seen as the latest and most direct basis for judging the future path of the Federal Reserve's monetary policy. Currently, the interest rate futures market has already priced in at least two rate cuts by 2026, and San Francisco Fed President Daly's comments last Friday that "the labor market is in a delicate state and may require further rate cuts" further reinforced dovish expectations. This expectation is the fundamental basis supporting gold prices' recent continued strength despite the high-interest-rate environment.
It is noteworthy that physical demand has provided structural support to the market. Latest data shows that the People's Bank of China increased its gold reserves for the 15th consecutive month in January. Analysts believe this reflects a clear diversification strategy aimed at reducing exposure to a single currency and related geopolitical and financial risks. Meanwhile, a senior market analyst points out that gold is regaining its historical role as a "neutral sovereign asset," especially given the significant decline in market willingness to hold the US dollar as a safe haven. This explains the higher-level demand logic for gold, partially deviating from the traditional interest rate-dollar framework.
By switching our perspective to a more detailed 4-hour chart, we can more clearly observe the current technical position of the market and changes in short-term momentum.
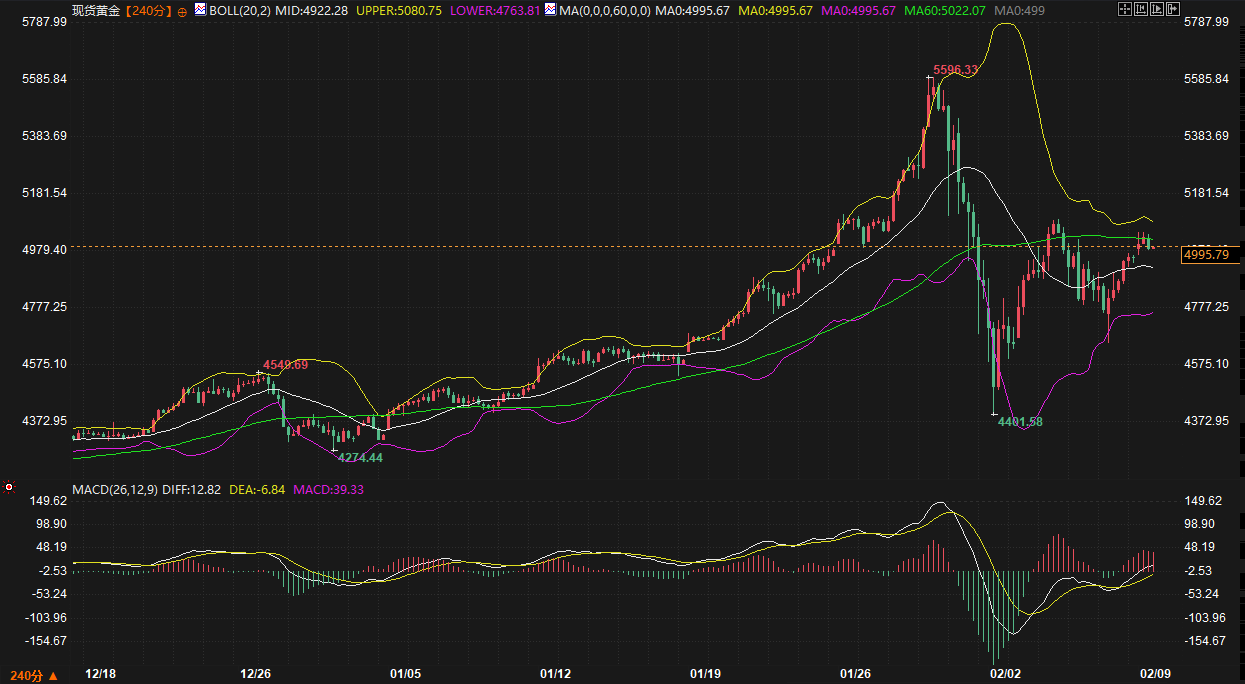
Price and Moving Average System : Gold prices retreated after hitting intraday highs and are currently consolidating around the $5,000 level. The key 60-period simple moving average (60 SMA) is currently around $5,022, forming the first technical resistance level above. Gold's failure to hold above this moving average is a signal that short-term momentum may be weakening. After the previous sharp rise, the market needs technical consolidation to digest profit-taking.
Bollinger Bands Analysis : The Bollinger Bands indicator provides a reference for price fluctuation range and trend status. Currently, the middle Bollinger Band is at $4922, forming the first support area below; while the upper band is around $5080, marking the recent strong upper boundary. The pullback in gold prices from near the upper band indicates that short-term overbought pressure has eased somewhat. If the market turns to consolidation, prices may seek support in the middle band area.
MACD Momentum Indicator Interpretation : The state of the MACD indicator warrants in-depth analysis. Currently, the DIFF line is at 12.51, the DEA line is at -6.90, and the MACD histogram is at 38.87. Although the histogram is still positive, indicating that bullish momentum remains, closer observation reveals that both the DIFF and DEA lines are below the zero line. This suggests that while the recent rebound momentum is strong, the overall trend momentum on the 4-hour chart has not yet fully transitioned from the previous correction to a strong bullish pattern. The golden cross of the DIFF and DEA lines below the zero line primarily represents a strong rebound. For a more solid upward trend to be established, the MACD lines need to effectively cross above the zero line.
In summary, the 4-hour chart shows that after a sharp rise, gold prices are facing resistance in the $5000-$5020 range. Technical indicators suggest a need for consolidation after the strong rebound, and the market is at a critical juncture, awaiting a new round of fundamental drivers to determine its direction.
Besides gold itself, the performance of precious metals and other related markets also provides indirect reference for judgment. Silver prices continued their strong performance on Monday, with significant intraday gains. This is partly due to its correlation with gold's precious metal attributes, and partly reflects a relative improvement in market risk appetite, as silver has stronger industrial and risk asset attributes. However, platinum and palladium bucked the trend and fell. This divergence indicates that the current rise in commodities is not a broad-based rally; funds are more focused on gold, which has strong monetary attributes and certain central bank demand, and silver, which benefits from specific industrial prospects.
Looking ahead to the coming week, the gold market will inevitably enter a "data-driven" mode.
Upside Scenario : If this week's US employment and inflation data are generally weak, reinforcing market expectations that the Federal Reserve will begin its rate-cutting cycle sooner and more quickly, the dollar may come under pressure, further increasing the attractiveness of gold. In that case, gold prices are expected to challenge and hold above the $5,000 mark again, and then test the upper Bollinger Band on the 4-hour chart (around $5,080) or even higher resistance. Technically, the MACD lines need to successfully cross above the zero line to confirm the continuation of the upward trend.
Downside/Sideways Scenario : Conversely, if economic data performs stronger than expected, indicating that the US economy remains resilient and inflation remains sticky, the market may revise its overly dovish expectations for interest rate cuts. This would provide support for the US dollar and increase the holding cost of gold. Gold prices may then seek support on the downside, primarily focusing on the support level of the 4-hour Bollinger Band middle line (around $4920). A break below this area would suggest that the recent rebound may have come to an end, and the market would enter a deeper correction or a wide-range consolidation pattern.
The core contradiction lies in the interplay between the market's urgent expectation of interest rate cuts and the still-evolving economic reality. Gold's repeated fluctuations around the $5,000 mark directly reflect this interplay on the charts. Investors should be wary of the risk of sharply increased market volatility before and after the release of important data. Until the trend becomes clearer, the market is more likely to consolidate around key price levels, awaiting final directional guidance.
Current market state: From explosive rise to high-level consolidation
At the start of the week, the gold market continued the strong momentum from last Friday. Against the backdrop of a weakening dollar, spot gold prices rose above $5012 per ounce in early European trading on Monday, attempting to solidify its breakout above the $5000 level. However, once the European session began, the upward momentum failed to continue, and prices retreated from their highs, with the latest quote falling back below $5000, indicating a significant divergence between bulls and bears near this important psychological and technical level.
The market's focus has now shifted entirely to the upcoming US January non-farm payrolls report, Consumer Price Index (CPI), and initial jobless claims data, all to be released this week. These figures will be seen as the latest and most direct basis for judging the future path of the Federal Reserve's monetary policy. Currently, the interest rate futures market has already priced in at least two rate cuts by 2026, and San Francisco Fed President Daly's comments last Friday that "the labor market is in a delicate state and may require further rate cuts" further reinforced dovish expectations. This expectation is the fundamental basis supporting gold prices' recent continued strength despite the high-interest-rate environment.
It is noteworthy that physical demand has provided structural support to the market. Latest data shows that the People's Bank of China increased its gold reserves for the 15th consecutive month in January. Analysts believe this reflects a clear diversification strategy aimed at reducing exposure to a single currency and related geopolitical and financial risks. Meanwhile, a senior market analyst points out that gold is regaining its historical role as a "neutral sovereign asset," especially given the significant decline in market willingness to hold the US dollar as a safe haven. This explains the higher-level demand logic for gold, partially deviating from the traditional interest rate-dollar framework.
Technical Analysis: Key Levels and Signals on the 4-Hour Chart
By switching our perspective to a more detailed 4-hour chart, we can more clearly observe the current technical position of the market and changes in short-term momentum.
Price and Moving Average System : Gold prices retreated after hitting intraday highs and are currently consolidating around the $5,000 level. The key 60-period simple moving average (60 SMA) is currently around $5,022, forming the first technical resistance level above. Gold's failure to hold above this moving average is a signal that short-term momentum may be weakening. After the previous sharp rise, the market needs technical consolidation to digest profit-taking.
Bollinger Bands Analysis : The Bollinger Bands indicator provides a reference for price fluctuation range and trend status. Currently, the middle Bollinger Band is at $4922, forming the first support area below; while the upper band is around $5080, marking the recent strong upper boundary. The pullback in gold prices from near the upper band indicates that short-term overbought pressure has eased somewhat. If the market turns to consolidation, prices may seek support in the middle band area.
MACD Momentum Indicator Interpretation : The state of the MACD indicator warrants in-depth analysis. Currently, the DIFF line is at 12.51, the DEA line is at -6.90, and the MACD histogram is at 38.87. Although the histogram is still positive, indicating that bullish momentum remains, closer observation reveals that both the DIFF and DEA lines are below the zero line. This suggests that while the recent rebound momentum is strong, the overall trend momentum on the 4-hour chart has not yet fully transitioned from the previous correction to a strong bullish pattern. The golden cross of the DIFF and DEA lines below the zero line primarily represents a strong rebound. For a more solid upward trend to be established, the MACD lines need to effectively cross above the zero line.
In summary, the 4-hour chart shows that after a sharp rise, gold prices are facing resistance in the $5000-$5020 range. Technical indicators suggest a need for consolidation after the strong rebound, and the market is at a critical juncture, awaiting a new round of fundamental drivers to determine its direction.
Related Market Observations and Future Trend Outlook
Besides gold itself, the performance of precious metals and other related markets also provides indirect reference for judgment. Silver prices continued their strong performance on Monday, with significant intraday gains. This is partly due to its correlation with gold's precious metal attributes, and partly reflects a relative improvement in market risk appetite, as silver has stronger industrial and risk asset attributes. However, platinum and palladium bucked the trend and fell. This divergence indicates that the current rise in commodities is not a broad-based rally; funds are more focused on gold, which has strong monetary attributes and certain central bank demand, and silver, which benefits from specific industrial prospects.
Looking ahead to the coming week, the gold market will inevitably enter a "data-driven" mode.
Upside Scenario : If this week's US employment and inflation data are generally weak, reinforcing market expectations that the Federal Reserve will begin its rate-cutting cycle sooner and more quickly, the dollar may come under pressure, further increasing the attractiveness of gold. In that case, gold prices are expected to challenge and hold above the $5,000 mark again, and then test the upper Bollinger Band on the 4-hour chart (around $5,080) or even higher resistance. Technically, the MACD lines need to successfully cross above the zero line to confirm the continuation of the upward trend.
Downside/Sideways Scenario : Conversely, if economic data performs stronger than expected, indicating that the US economy remains resilient and inflation remains sticky, the market may revise its overly dovish expectations for interest rate cuts. This would provide support for the US dollar and increase the holding cost of gold. Gold prices may then seek support on the downside, primarily focusing on the support level of the 4-hour Bollinger Band middle line (around $4920). A break below this area would suggest that the recent rebound may have come to an end, and the market would enter a deeper correction or a wide-range consolidation pattern.
The core contradiction lies in the interplay between the market's urgent expectation of interest rate cuts and the still-evolving economic reality. Gold's repeated fluctuations around the $5,000 mark directly reflect this interplay on the charts. Investors should be wary of the risk of sharply increased market volatility before and after the release of important data. Until the trend becomes clearer, the market is more likely to consolidate around key price levels, awaiting final directional guidance.
- Risk Warning and Disclaimer
- The market involves risk, and trading may not be suitable for all investors. This article is for reference only and does not constitute personal investment advice, nor does it take into account certain users’ specific investment objectives, financial situation, or other needs. Any investment decisions made based on this information are at your own risk.