Gold Outlook: Risk of a "dead cat bounce" continues to rise in high-level areas.
2026-02-12 19:44:09
Currently, as international gold prices approach historical highs, the upward momentum is gradually weakening, and trading volume is showing a continuous shrinking trend. Meanwhile, the Commitment of Traders (COT) report released by the U.S. Commodity Futures Trading Commission (CFTC) shows that large-scale long position liquidation occurred in the market ahead of the release of U.S. Consumer Price Index (CPI) data, indicating that the risk of a pullback in gold prices at these high levels is accumulating.

Looking at recent trends, the rebound in gold prices, which began around 4700 points, has been quite impressive overall, with a significant cumulative increase. However, it's worth noting that as prices approached historical highs, the pace of the upward movement slowed noticeably, indicating intensified competition between bulls and bears. This price action serves as a reminder to bullish investors to remain highly cautious and avoid blindly chasing the price higher.
Looking back at last week's market performance, I predicted that after gold prices successfully found support near the 4700 level, the previous rebound was likely to continue. However, considering this week's price action, it's clear that bullish momentum has weakened significantly, and downward pressure is gradually emerging. At this point, bulls need to be more wary of potential downside risks.
Of particular note is the upcoming release of the US CPI data. As a core indicator of US inflation, this figure will directly impact gold prices. Market expectations suggest that even a slightly higher-than-expected CPI figure could fuel speculation of a tightening of the Federal Reserve's monetary policy, negatively impacting non-interest-bearing assets like gold and causing a temporary pullback in gold prices.
Technical Analysis
From a technical perspective, gold futures prices have rebounded by 16.3% since the lows in early February, demonstrating a relatively strong upward trend. However, as prices continue to rise, market volatility has shown a clear downward trend. This divergence indicates that the bullish momentum driving gold prices higher is gradually being exhausted, and the enthusiasm of bullish participants in the market has cooled down.
More importantly, during this rebound, the trading volume of gold futures has consistently declined, creating a "volume-price divergence." This signal usually indicates that the current rebound lacks sufficient financial support, and the probability of a subsequent correction is increasing.
However, it's important to clarify that for gold prices to experience a deep correction, a crucial condition must be met: a decisive break below the lows formed in early February is necessary, followed by a continuation of the downward trend that began from historical highs. If this occurs, it means that the current market rebound is likely a classic "dead cat bounce"—a short-term, false rally—and the market will subsequently revert to its downward trend, continuing the previous correction pattern.
Combining the daily and hourly charts of COMEX gold futures, the following key signals can be identified: First, a clear resistance zone has formed around the 5126 level, with gold prices repeatedly testing this point without a successful breakout, indicating heavy selling pressure in this area; second, the weekly volume control points (VPOC) are located at 5084 and 4943, respectively, and these two levels will become important support levels during subsequent price pullbacks; third, trading volume and volatility are declining in tandem, further confirming the assessment of weakening bullish momentum; fourth, the Relative Strength Index (RSI) shows a clear weakening trend as gold prices fall below historical highs, suggesting that bullish forces in the market are waning.
Gold pullback target analysis: 4943 and 4800 levels become key support.
Based on current market trends, technical signals, and open interest data, my current baseline assessment is that in the short term, gold prices will likely hold above the lows formed in early February and will not experience a significant downward breakout. However, the market's rebound momentum will further weaken, and prices may enter a period of consolidation.
From a negative perspective, there are currently no core negative catalysts in the market sufficient to trigger a new round of sharp declines in gold prices. Neither the macroeconomic environment nor policy has experienced any substantial negative impact. Meanwhile, futures position data also shows that this round of gold price declines is mainly due to the concentrated stop-loss exits of previously holding long positions, rather than being triggered by short sellers actively building large short positions. This characteristic also determines that the current downward momentum of gold prices is relatively limited.
From a price trend perspective, gold prices formed a spiral top pattern near previous historical highs, and the current rebound encountered resistance and fell back near the low point of this spiral top. This trend reflects the increasing divergence between bulls and bears in the market, with heavy selling pressure above. Currently, traders are closely watching the key resistance level of 5126. If gold prices can effectively break through this level, accompanied by a significant increase in trading volume, then it may further advance towards the vicinity of 5270, continuing the rebound; however, given the current market situation, this possibility is relatively low.
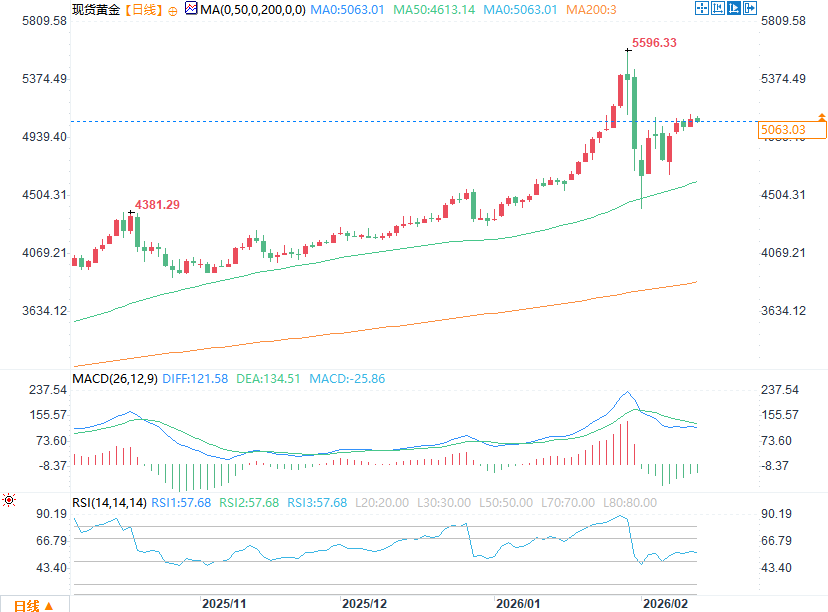
(Spot gold daily chart source: FX678)
I will focus on two key signals: first, whether a bearish reversal candlestick pattern will appear on the daily chart; and second, whether the intraday price action will form a swing high. If either of these signals appears, it will signify the official start of a pullback in gold prices, with a downside target at least at the weekly volume control point (VPOC) of 4943. If this level fails to provide support, the price will further test the important psychological level of 4800.
However, I also believe that a large number of bullish investors are still on the sidelines, waiting for a reasonable pullback in gold prices before buying in and rejoining the medium-term upward trend of gold. This "buying on dips" force will, to some extent, limit the downside potential of gold prices, and will likely keep them above the lows of early February (around 4400 points), preventing an excessive decline.
Gold Futures Position Analysis: In-depth Interpretation of the COT Report
According to the Commitment of Traders (COT) report on gold futures released by the U.S. Commodity Futures Trading Commission (CFTC), since the peak of net long positions in gold in September 2024, futures market traders have maintained a cautious attitude towards the rebound in gold prices and have not blindly followed the trend to go long.
As gold prices gradually climbed towards the $5,000/ounce mark, long positions did indeed rebound to some extent, reflecting some investors' continued optimism about the future price trend. However, as gold prices experienced a temporary pullback and market volatility surged, long investors who had previously held positions began to liquidate their holdings en masse, triggering a significant wave of long position liquidations.
Specific data shows that net long positions in gold futures decreased by approximately 80,000 contracts over the past two weeks, marking the largest two-week drop in nearly nine years, clearly indicating panic selling by long positions in the market. Meanwhile, although total short positions increased slightly, they remain at a relatively low level. This data clearly shows that the current decline in gold prices is primarily due to long position liquidation, rather than a large-scale short-selling by short sellers; the two have fundamentally different market implications.
This downward trend, driven primarily by long position liquidation, will provide some support for gold prices. Even though the current gold price movement suggests a potential deeper correction, the lack of active selling pressure and the presence of bargain hunters waiting to enter the market will significantly limit the downside potential and prevent a sustained, sharp decline.
Combining the weekly chart of COMEX gold futures prices and CFTC COT position data, it can be seen that net long positions in gold have declined sharply in the past two weeks, with a clear trend of concentrated liquidation of long positions. Currently, gold prices are still fluctuating around $5,000 per ounce, and the battle between bulls and bears has entered a critical stage.
Looking at recent trends, the rebound in gold prices, which began around 4700 points, has been quite impressive overall, with a significant cumulative increase. However, it's worth noting that as prices approached historical highs, the pace of the upward movement slowed noticeably, indicating intensified competition between bulls and bears. This price action serves as a reminder to bullish investors to remain highly cautious and avoid blindly chasing the price higher.
Looking back at last week's market performance, I predicted that after gold prices successfully found support near the 4700 level, the previous rebound was likely to continue. However, considering this week's price action, it's clear that bullish momentum has weakened significantly, and downward pressure is gradually emerging. At this point, bulls need to be more wary of potential downside risks.
Of particular note is the upcoming release of the US CPI data. As a core indicator of US inflation, this figure will directly impact gold prices. Market expectations suggest that even a slightly higher-than-expected CPI figure could fuel speculation of a tightening of the Federal Reserve's monetary policy, negatively impacting non-interest-bearing assets like gold and causing a temporary pullback in gold prices.
Technical Analysis
From a technical perspective, gold futures prices have rebounded by 16.3% since the lows in early February, demonstrating a relatively strong upward trend. However, as prices continue to rise, market volatility has shown a clear downward trend. This divergence indicates that the bullish momentum driving gold prices higher is gradually being exhausted, and the enthusiasm of bullish participants in the market has cooled down.
More importantly, during this rebound, the trading volume of gold futures has consistently declined, creating a "volume-price divergence." This signal usually indicates that the current rebound lacks sufficient financial support, and the probability of a subsequent correction is increasing.
However, it's important to clarify that for gold prices to experience a deep correction, a crucial condition must be met: a decisive break below the lows formed in early February is necessary, followed by a continuation of the downward trend that began from historical highs. If this occurs, it means that the current market rebound is likely a classic "dead cat bounce"—a short-term, false rally—and the market will subsequently revert to its downward trend, continuing the previous correction pattern.
Combining the daily and hourly charts of COMEX gold futures, the following key signals can be identified: First, a clear resistance zone has formed around the 5126 level, with gold prices repeatedly testing this point without a successful breakout, indicating heavy selling pressure in this area; second, the weekly volume control points (VPOC) are located at 5084 and 4943, respectively, and these two levels will become important support levels during subsequent price pullbacks; third, trading volume and volatility are declining in tandem, further confirming the assessment of weakening bullish momentum; fourth, the Relative Strength Index (RSI) shows a clear weakening trend as gold prices fall below historical highs, suggesting that bullish forces in the market are waning.
Gold pullback target analysis: 4943 and 4800 levels become key support.
Based on current market trends, technical signals, and open interest data, my current baseline assessment is that in the short term, gold prices will likely hold above the lows formed in early February and will not experience a significant downward breakout. However, the market's rebound momentum will further weaken, and prices may enter a period of consolidation.
From a negative perspective, there are currently no core negative catalysts in the market sufficient to trigger a new round of sharp declines in gold prices. Neither the macroeconomic environment nor policy has experienced any substantial negative impact. Meanwhile, futures position data also shows that this round of gold price declines is mainly due to the concentrated stop-loss exits of previously holding long positions, rather than being triggered by short sellers actively building large short positions. This characteristic also determines that the current downward momentum of gold prices is relatively limited.
From a price trend perspective, gold prices formed a spiral top pattern near previous historical highs, and the current rebound encountered resistance and fell back near the low point of this spiral top. This trend reflects the increasing divergence between bulls and bears in the market, with heavy selling pressure above. Currently, traders are closely watching the key resistance level of 5126. If gold prices can effectively break through this level, accompanied by a significant increase in trading volume, then it may further advance towards the vicinity of 5270, continuing the rebound; however, given the current market situation, this possibility is relatively low.
(Spot gold daily chart source: FX678)
I will focus on two key signals: first, whether a bearish reversal candlestick pattern will appear on the daily chart; and second, whether the intraday price action will form a swing high. If either of these signals appears, it will signify the official start of a pullback in gold prices, with a downside target at least at the weekly volume control point (VPOC) of 4943. If this level fails to provide support, the price will further test the important psychological level of 4800.
However, I also believe that a large number of bullish investors are still on the sidelines, waiting for a reasonable pullback in gold prices before buying in and rejoining the medium-term upward trend of gold. This "buying on dips" force will, to some extent, limit the downside potential of gold prices, and will likely keep them above the lows of early February (around 4400 points), preventing an excessive decline.
Gold Futures Position Analysis: In-depth Interpretation of the COT Report
According to the Commitment of Traders (COT) report on gold futures released by the U.S. Commodity Futures Trading Commission (CFTC), since the peak of net long positions in gold in September 2024, futures market traders have maintained a cautious attitude towards the rebound in gold prices and have not blindly followed the trend to go long.
As gold prices gradually climbed towards the $5,000/ounce mark, long positions did indeed rebound to some extent, reflecting some investors' continued optimism about the future price trend. However, as gold prices experienced a temporary pullback and market volatility surged, long investors who had previously held positions began to liquidate their holdings en masse, triggering a significant wave of long position liquidations.
Specific data shows that net long positions in gold futures decreased by approximately 80,000 contracts over the past two weeks, marking the largest two-week drop in nearly nine years, clearly indicating panic selling by long positions in the market. Meanwhile, although total short positions increased slightly, they remain at a relatively low level. This data clearly shows that the current decline in gold prices is primarily due to long position liquidation, rather than a large-scale short-selling by short sellers; the two have fundamentally different market implications.
This downward trend, driven primarily by long position liquidation, will provide some support for gold prices. Even though the current gold price movement suggests a potential deeper correction, the lack of active selling pressure and the presence of bargain hunters waiting to enter the market will significantly limit the downside potential and prevent a sustained, sharp decline.
Combining the weekly chart of COMEX gold futures prices and CFTC COT position data, it can be seen that net long positions in gold have declined sharply in the past two weeks, with a clear trend of concentrated liquidation of long positions. Currently, gold prices are still fluctuating around $5,000 per ounce, and the battle between bulls and bears has entered a critical stage.
- Risk Warning and Disclaimer
- The market involves risk, and trading may not be suitable for all investors. This article is for reference only and does not constitute personal investment advice, nor does it take into account certain users’ specific investment objectives, financial situation, or other needs. Any investment decisions made based on this information are at your own risk.