US Treasury yields are about to fall to 4.05%, so why is no one daring to buy the dip?
2026-02-16 17:41:50
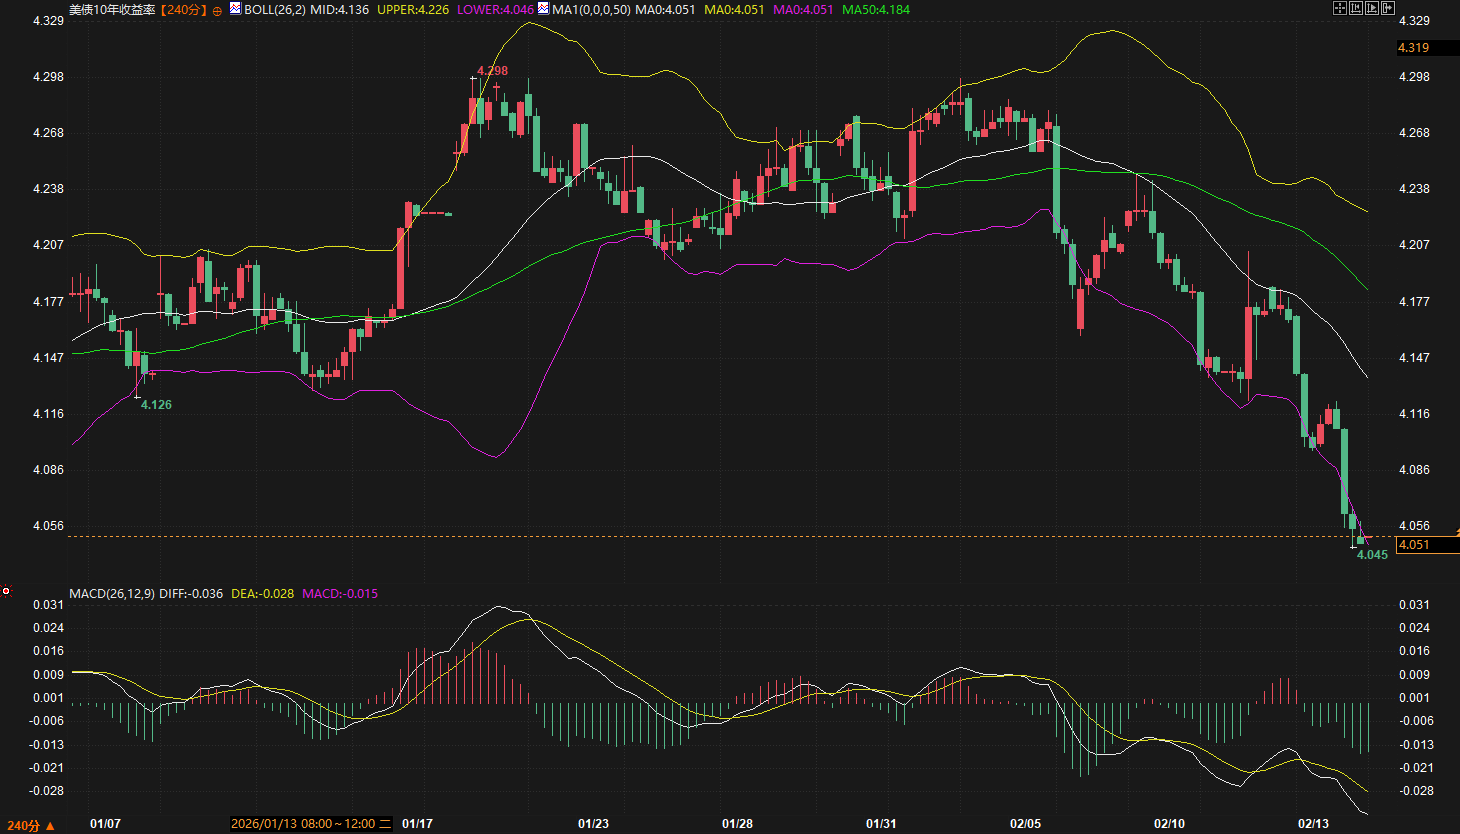
On Monday (February 16), US financial markets were closed for the Presidents' Day holiday, and major Asian markets were also closed for the Lunar New Year holiday, leading to cautious trading sentiment in global bond markets. As of the afternoon Beijing time, the yield on the 10-year US Treasury bond was 4.051%, remaining near the lower end of its recent trading range. Looking at the 240-minute chart, US Treasury yields have been declining since February 5, currently approaching the lower Bollinger Band at 4.046%, indicating oversold conditions but without a clear sign of stabilization.

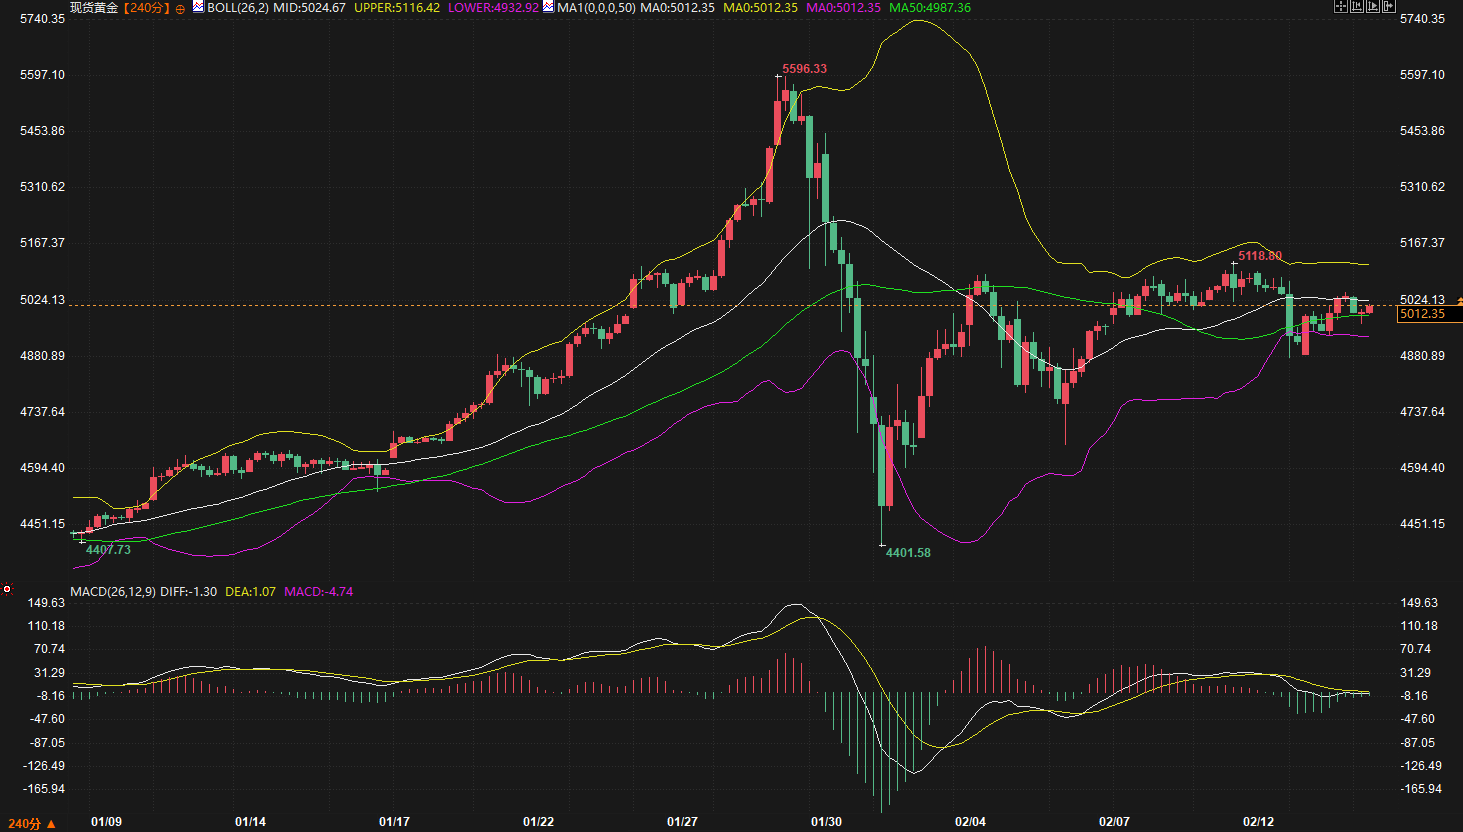
Holiday factors significantly impacted global asset pricing at the beginning of this week. Analysts from well-known institutions pointed out that gold's current consolidation around $5,000 per ounce largely reflects the market's low liquidity characteristic during the holiday season. This logic also applies to the US Treasury market—with major trading centers closed, price discovery mechanisms are weakened, making the market more susceptible to fluctuations in the foreign exchange market.
In the foreign exchange market, the US dollar index rose moderately on Monday, last trading at 96.9589, regaining its position above the middle Bollinger Band on the 240-minute chart. Technically, the dollar index retreated after reaching a high on February 5th, but has since found support near the lower Bollinger Band around 96.63 and rebounded. The MACD indicator shows a narrowing of the negative momentum bars, and the DIFF line is showing initial signs of breaking above the DEA, indicating that short-term rebound momentum is building. For US Treasuries, a stronger dollar means higher exchange rates for non-US investors holding US Treasuries, potentially dampening cross-border buying sentiment, especially given the absence of major Asian investors due to holidays.
It's worth noting that Federal Reserve officials released policy signals last Friday. The president of the Chicago Fed stated that there is room for interest rate cuts, but also emphasized that inflation in the services sector remains high. The market has largely priced in the Fed maintaining interest rates at its March 18 meeting, but the mixed signals from inflation data and the labor market mean that the future policy path remains uncertain. The historical pattern of non-yielding assets performing better in low-interest-rate environments suggests that further declines in US Treasury yields will require a build-up of easing signals.
From the 240-minute technical chart of the 10-year US Treasury yield, the market is currently in a critical phase of oscillation. The Bollinger Bands indicate that the middle band at 4.136% and the lower band at 4.046% constitute a short-term trading range, with the current price at 4.051% approaching the lower band support. Looking at the moving average system, the 50-day moving average (MA50) is at 4.184%, significantly deviating from the current price. This reflects both the degree of short-term oversold conditions and means that any rebound will first face technical resistance from this moving average.
Regarding the MACD indicator, the DIFF and DEA are operating in negative territory, but the negative histogram shows a slight narrowing, indicating a weakening of downward momentum. However, this signal is not enough to confirm a trend reversal; it is necessary to observe whether a golden cross can form at a low level. In terms of candlestick patterns, during the downward phase since February 5th, green candlesticks have clearly dominated, and the price has broken through multiple moving average supports, indicating that bearish forces have been in control recently.
In contrast to the US Treasury yields, the technical pattern of the gold market is as follows. Spot gold is oscillating around the Bollinger Band middle line at $5024.67 on the 240-minute chart. Although the MACD indicator's DIFF line is still below the DEA, the negative histogram has contracted significantly compared to the previous period. Analysts from well-known institutions have adjusted their medium-term target from $5500 to the $5100-$5200 range. This adjustment reflects both an acceptance of the current oscillating pattern and suggests that if US Treasury yields stabilize and rebound, further upside potential for gold may be limited.
Cross-market comparisons offer a unique perspective when assessing the short-term trajectory of US Treasuries. A renowned investment strategy expert points out that the widely discussed "dollar depreciation trade" suffers from a cognitive bias—investors overestimate the predicament facing the dollar while underestimating the risks associated with US Treasuries. Data shows that the convenient yield on the dollar against the euro has remained stable and positive over the past decade, indicating that market participants still prefer to hold dollars directly rather than replicate it through derivatives. However, the convenient yield on US Treasuries relative to German government bonds has turned negative over the past 15 years, meaning that investors perceive holding 10-year US Treasuries directly as riskier than replicating US Treasury exposure through German government bonds.
This phenomenon suggests that the safe-haven appeal of US Treasuries is not invincible. Over the past six months, the preferred yield on US Treasuries relative to German bonds has rebounded, primarily reflecting Germany's increased fiscal deficit due to defense and infrastructure spending, which has narrowed the fiscal gap between the two countries. However, if the US fiscal situation unexpectedly deteriorates, this indicator could come under renewed pressure.
Does the current market pricing of US Treasury bonds fully reflect fiscal risks? This is a core issue that needs close monitoring in the future. Calculations by well-known institutions indicate that if certain tariff bills are ruled illegal, they could impact annual fiscal revenue by approximately $100-130 billion, further pressuring the already existing fiscal deficit of 5.8%-6.0%. Although this risk has not yet materialized, it has already laid the groundwork for the medium- to long-term trend of US Treasury bonds.
Looking ahead to the next two trading days, the holiday effect will remain a key variable dominating market sentiment. US markets will resume normal trading on Tuesday after Monday's closure, but the continued closure of Asian markets means that buying power from that region will remain absent. Against this backdrop, the 10-year US Treasury yield is likely to consolidate within the 4.046%-4.136% range, with the lower and middle Bollinger Bands forming the short-term volatility boundary.
Two key signals to watch during the trading session: First, whether the US dollar index can hold above 96.86 and further test the 97.10 resistance level. If the dollar continues to rebound, US Treasury bonds will face continued pressure. Second, changes in risk appetite after the reopening of US stocks. If the equity market performs steadily, it may divert funds from the bond market.
From a risk premium perspective, the current pricing of fiscal factors in the US Treasury market is still insufficient, but this is more of a medium-term logic and unlikely to become the dominant variable in the short term. The market in the next two days is more likely to continue the tug-of-war between the technical oversold condition and the holiday liquidity tightening. Yields may see a technical rebound near the lower bound, but the strength will be limited by the moving average resistance, and a trend breakout will require a new catalyst.
Holiday effect combined with dollar rebound and continued external pressure on US Treasury bonds
Holiday factors significantly impacted global asset pricing at the beginning of this week. Analysts from well-known institutions pointed out that gold's current consolidation around $5,000 per ounce largely reflects the market's low liquidity characteristic during the holiday season. This logic also applies to the US Treasury market—with major trading centers closed, price discovery mechanisms are weakened, making the market more susceptible to fluctuations in the foreign exchange market.
In the foreign exchange market, the US dollar index rose moderately on Monday, last trading at 96.9589, regaining its position above the middle Bollinger Band on the 240-minute chart. Technically, the dollar index retreated after reaching a high on February 5th, but has since found support near the lower Bollinger Band around 96.63 and rebounded. The MACD indicator shows a narrowing of the negative momentum bars, and the DIFF line is showing initial signs of breaking above the DEA, indicating that short-term rebound momentum is building. For US Treasuries, a stronger dollar means higher exchange rates for non-US investors holding US Treasuries, potentially dampening cross-border buying sentiment, especially given the absence of major Asian investors due to holidays.
It's worth noting that Federal Reserve officials released policy signals last Friday. The president of the Chicago Fed stated that there is room for interest rate cuts, but also emphasized that inflation in the services sector remains high. The market has largely priced in the Fed maintaining interest rates at its March 18 meeting, but the mixed signals from inflation data and the labor market mean that the future policy path remains uncertain. The historical pattern of non-yielding assets performing better in low-interest-rate environments suggests that further declines in US Treasury yields will require a build-up of easing signals.
Technical indicators reveal key levels in the battle between bulls and bears.
From the 240-minute technical chart of the 10-year US Treasury yield, the market is currently in a critical phase of oscillation. The Bollinger Bands indicate that the middle band at 4.136% and the lower band at 4.046% constitute a short-term trading range, with the current price at 4.051% approaching the lower band support. Looking at the moving average system, the 50-day moving average (MA50) is at 4.184%, significantly deviating from the current price. This reflects both the degree of short-term oversold conditions and means that any rebound will first face technical resistance from this moving average.
Regarding the MACD indicator, the DIFF and DEA are operating in negative territory, but the negative histogram shows a slight narrowing, indicating a weakening of downward momentum. However, this signal is not enough to confirm a trend reversal; it is necessary to observe whether a golden cross can form at a low level. In terms of candlestick patterns, during the downward phase since February 5th, green candlesticks have clearly dominated, and the price has broken through multiple moving average supports, indicating that bearish forces have been in control recently.
In contrast to the US Treasury yields, the technical pattern of the gold market is as follows. Spot gold is oscillating around the Bollinger Band middle line at $5024.67 on the 240-minute chart. Although the MACD indicator's DIFF line is still below the DEA, the negative histogram has contracted significantly compared to the previous period. Analysts from well-known institutions have adjusted their medium-term target from $5500 to the $5100-$5200 range. This adjustment reflects both an acceptance of the current oscillating pattern and suggests that if US Treasury yields stabilize and rebound, further upside potential for gold may be limited.
Cross-validation of the US dollar and Japanese bonds: The "convenience yield" of US Treasuries holds hidden secrets.
Cross-market comparisons offer a unique perspective when assessing the short-term trajectory of US Treasuries. A renowned investment strategy expert points out that the widely discussed "dollar depreciation trade" suffers from a cognitive bias—investors overestimate the predicament facing the dollar while underestimating the risks associated with US Treasuries. Data shows that the convenient yield on the dollar against the euro has remained stable and positive over the past decade, indicating that market participants still prefer to hold dollars directly rather than replicate it through derivatives. However, the convenient yield on US Treasuries relative to German government bonds has turned negative over the past 15 years, meaning that investors perceive holding 10-year US Treasuries directly as riskier than replicating US Treasury exposure through German government bonds.
This phenomenon suggests that the safe-haven appeal of US Treasuries is not invincible. Over the past six months, the preferred yield on US Treasuries relative to German bonds has rebounded, primarily reflecting Germany's increased fiscal deficit due to defense and infrastructure spending, which has narrowed the fiscal gap between the two countries. However, if the US fiscal situation unexpectedly deteriorates, this indicator could come under renewed pressure.
Does the current market pricing of US Treasury bonds fully reflect fiscal risks? This is a core issue that needs close monitoring in the future. Calculations by well-known institutions indicate that if certain tariff bills are ruled illegal, they could impact annual fiscal revenue by approximately $100-130 billion, further pressuring the already existing fiscal deficit of 5.8%-6.0%. Although this risk has not yet materialized, it has already laid the groundwork for the medium- to long-term trend of US Treasury bonds.
Outlook for the next 2-3 days: Searching for direction within a narrow range.
Looking ahead to the next two trading days, the holiday effect will remain a key variable dominating market sentiment. US markets will resume normal trading on Tuesday after Monday's closure, but the continued closure of Asian markets means that buying power from that region will remain absent. Against this backdrop, the 10-year US Treasury yield is likely to consolidate within the 4.046%-4.136% range, with the lower and middle Bollinger Bands forming the short-term volatility boundary.
Two key signals to watch during the trading session: First, whether the US dollar index can hold above 96.86 and further test the 97.10 resistance level. If the dollar continues to rebound, US Treasury bonds will face continued pressure. Second, changes in risk appetite after the reopening of US stocks. If the equity market performs steadily, it may divert funds from the bond market.
From a risk premium perspective, the current pricing of fiscal factors in the US Treasury market is still insufficient, but this is more of a medium-term logic and unlikely to become the dominant variable in the short term. The market in the next two days is more likely to continue the tug-of-war between the technical oversold condition and the holiday liquidity tightening. Yields may see a technical rebound near the lower bound, but the strength will be limited by the moving average resistance, and a trend breakout will require a new catalyst.
- Risk Warning and Disclaimer
- The market involves risk, and trading may not be suitable for all investors. This article is for reference only and does not constitute personal investment advice, nor does it take into account certain users’ specific investment objectives, financial situation, or other needs. Any investment decisions made based on this information are at your own risk.