Bulls are testing the value range; gold prices are predicted to test the 50-day moving average.
2026-02-18 20:48:38
On Wednesday (February 18), during the European session, gold entered a period of consolidation. After clearly breaking below the key 50% Fibonacci retracement level near $5000 in the previous trading day, spot gold touched a two-week low of $4842.60 yesterday, before rebounding slightly today. This low is not a key support level, and selling pressure is expected to continue at least to the dense support zone of $4760.87-$4744.34, with the core downside target at the 50-day moving average of $4672.09.

Long-term bulls are interested in buying, but are only willing to enter at their target price.
Following last month's significant gains, long-term bullish investors will attempt to accumulate as much gold as possible during this consolidation period, but they will only buy at their own pace and at prices they deem acceptable. Recent price action suggests that traders are not inclined to actively chase higher prices, so placing buy orders at lower prices will be their preferred strategy.
Once this consolidation period ends and buyers have accumulated sufficient gold positions, market momentum will shift upwards, leading to aggressive buying. Please be patient, as this process may take several months.
The Fed's June meeting may be a catalyst for ending the consolidation.
Currently, if geopolitical tensions trigger market panic, prompting traders to abandon value considerations and buy regardless of price, gold prices may surge. However, if the traditional correlation between interest rates, the US dollar, and gold holds true, then the consolidation phase may continue until June. Why June? The Federal Reserve's interest rate meeting that month is expected to be chaired by Kevin Warsh, President Trump's newly appointed advisor. Furthermore, the Fed will have access to employment and inflation data for the coming months, enabling it to make a final decision on interest rate cuts.
The FedWatch Tool indicates a 50/50 probability of a rate cut in June—that's the core logic.
Currently, the CME FedWatch Tool shows a 92.1% probability that the Fed will keep interest rates unchanged at its March meeting, while the probability of a 25 basis point rate cut in June is only 50.2%. I believe it is precisely this 50/50 probability of a June rate cut that has driven gold into its current consolidation phase, making this indicator crucial to monitor. If the probability of a rate cut continues to rise, gold prices will rise accordingly; if the probability falls significantly, gold prices are expected to continue their downward trend.
The future trend of the US dollar may determine the direction of gold.
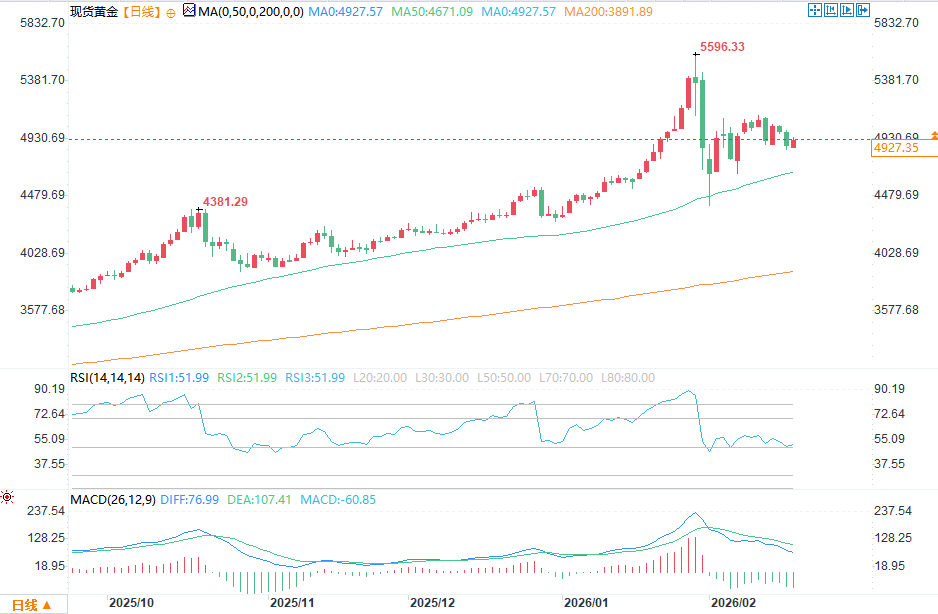
(Spot gold daily chart source: FX678)
The consolidation of the US dollar index has also impacted gold prices. The dollar index touched a low of 95.551 on the day the Federal Reserve released its latest monetary policy statement, and gold subsequently reached a record high of $5602.23 the following day. Like gold, the dollar index is currently consolidating below its 50-day and 200-day moving averages. If buyers push the dollar index above the 200-day moving average of 98.455, spot gold could fall sharply, testing the 50-day moving average at $4672.09, and even retracing to the low of $4402.38 reached on February 2nd.
Key takeaway: The accumulation phase may last for several months; investors need to remain patient.
In summary, after failing to break upwards recently, spot gold is gradually declining towards its intrinsic value range. This suggests that traders are not actively chasing highs but are instead attempting to accumulate positions in batches at prices they deem appropriate. The 50-day moving average is the first key reference point for finding value entry points. If the Federal Reserve fails to release clear policy signals, the consolidation phase could continue for several months; however, close attention should be paid to the Fed's watchdog tools. A significant shift in the 50/50 probability of a June rate cut could act as a catalyst to break out of the consolidation phase in the gold market.
Long-term bulls are interested in buying, but are only willing to enter at their target price.
Following last month's significant gains, long-term bullish investors will attempt to accumulate as much gold as possible during this consolidation period, but they will only buy at their own pace and at prices they deem acceptable. Recent price action suggests that traders are not inclined to actively chase higher prices, so placing buy orders at lower prices will be their preferred strategy.
Once this consolidation period ends and buyers have accumulated sufficient gold positions, market momentum will shift upwards, leading to aggressive buying. Please be patient, as this process may take several months.
The Fed's June meeting may be a catalyst for ending the consolidation.
Currently, if geopolitical tensions trigger market panic, prompting traders to abandon value considerations and buy regardless of price, gold prices may surge. However, if the traditional correlation between interest rates, the US dollar, and gold holds true, then the consolidation phase may continue until June. Why June? The Federal Reserve's interest rate meeting that month is expected to be chaired by Kevin Warsh, President Trump's newly appointed advisor. Furthermore, the Fed will have access to employment and inflation data for the coming months, enabling it to make a final decision on interest rate cuts.
The FedWatch Tool indicates a 50/50 probability of a rate cut in June—that's the core logic.
Currently, the CME FedWatch Tool shows a 92.1% probability that the Fed will keep interest rates unchanged at its March meeting, while the probability of a 25 basis point rate cut in June is only 50.2%. I believe it is precisely this 50/50 probability of a June rate cut that has driven gold into its current consolidation phase, making this indicator crucial to monitor. If the probability of a rate cut continues to rise, gold prices will rise accordingly; if the probability falls significantly, gold prices are expected to continue their downward trend.
The future trend of the US dollar may determine the direction of gold.
(Spot gold daily chart source: FX678)
The consolidation of the US dollar index has also impacted gold prices. The dollar index touched a low of 95.551 on the day the Federal Reserve released its latest monetary policy statement, and gold subsequently reached a record high of $5602.23 the following day. Like gold, the dollar index is currently consolidating below its 50-day and 200-day moving averages. If buyers push the dollar index above the 200-day moving average of 98.455, spot gold could fall sharply, testing the 50-day moving average at $4672.09, and even retracing to the low of $4402.38 reached on February 2nd.
Key takeaway: The accumulation phase may last for several months; investors need to remain patient.
In summary, after failing to break upwards recently, spot gold is gradually declining towards its intrinsic value range. This suggests that traders are not actively chasing highs but are instead attempting to accumulate positions in batches at prices they deem appropriate. The 50-day moving average is the first key reference point for finding value entry points. If the Federal Reserve fails to release clear policy signals, the consolidation phase could continue for several months; however, close attention should be paid to the Fed's watchdog tools. A significant shift in the 50/50 probability of a June rate cut could act as a catalyst to break out of the consolidation phase in the gold market.
- Risk Warning and Disclaimer
- The market involves risk, and trading may not be suitable for all investors. This article is for reference only and does not constitute personal investment advice, nor does it take into account certain users’ specific investment objectives, financial situation, or other needs. Any investment decisions made based on this information are at your own risk.