Gold broke through 5150 and then stalled at 5176. This signal from US Treasury bonds will determine whether it can continue to rise.
2026-02-23 21:14:05
On Monday (February 23), global financial markets experienced significant volatility due to the US Supreme Court's ruling on tariff policy. The US dollar index initially dipped to around 97.36 before recovering slightly to the 97.78 area; spot gold, meanwhile, broke through the $5150 mark, reaching a high of around $5176, a three-week high. The US Treasury market exhibited a "rise then fall" pattern, with the 10-year Treasury yield briefly declining driven by risk aversion, but gradually recovering to around 4.074% after the European session. Overall, the market is repricing US policy uncertainty, and the structural divergence in asset prices is becoming increasingly apparent.

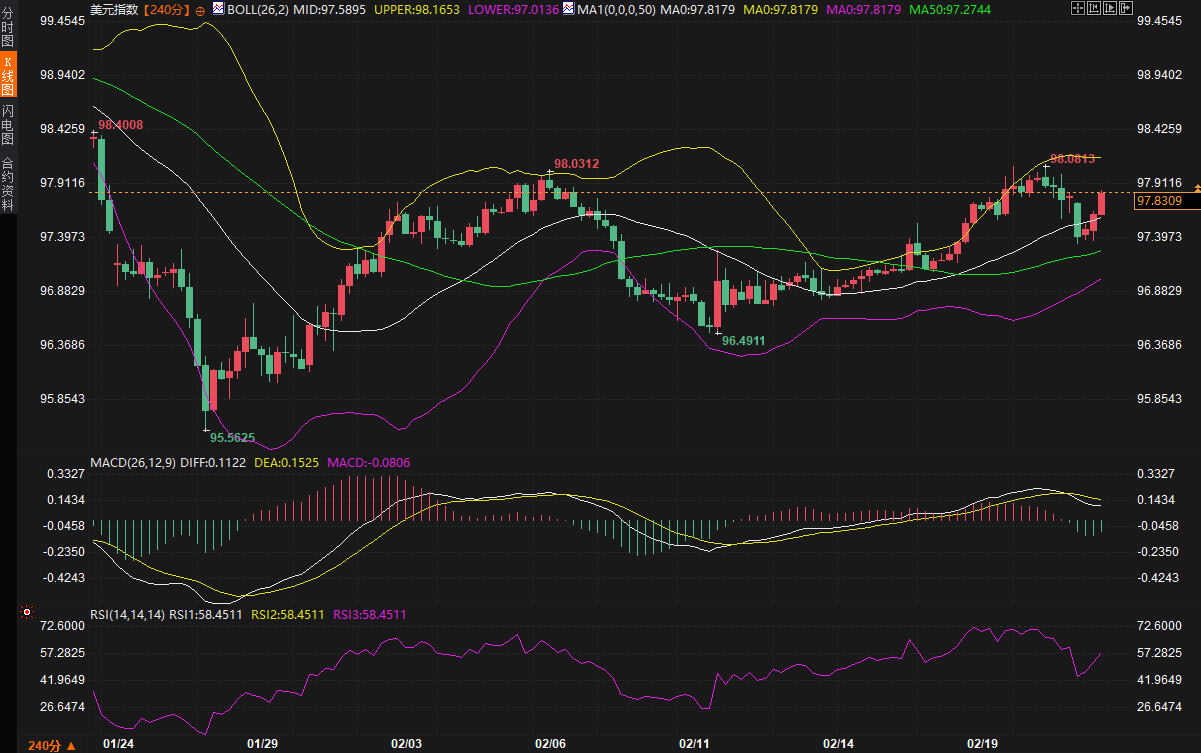
The U.S. Supreme Court's ruling last Friday that Trump's previous comprehensive tariff measures exceeded executive authority directly triggered a risk-averse market reaction after Monday's opening. The dollar index fell to 97.36 in early Asian trading, and although it subsequently recovered some ground to around 97.83, from a technical perspective, market concerns about policy uncertainty have not completely dissipated.
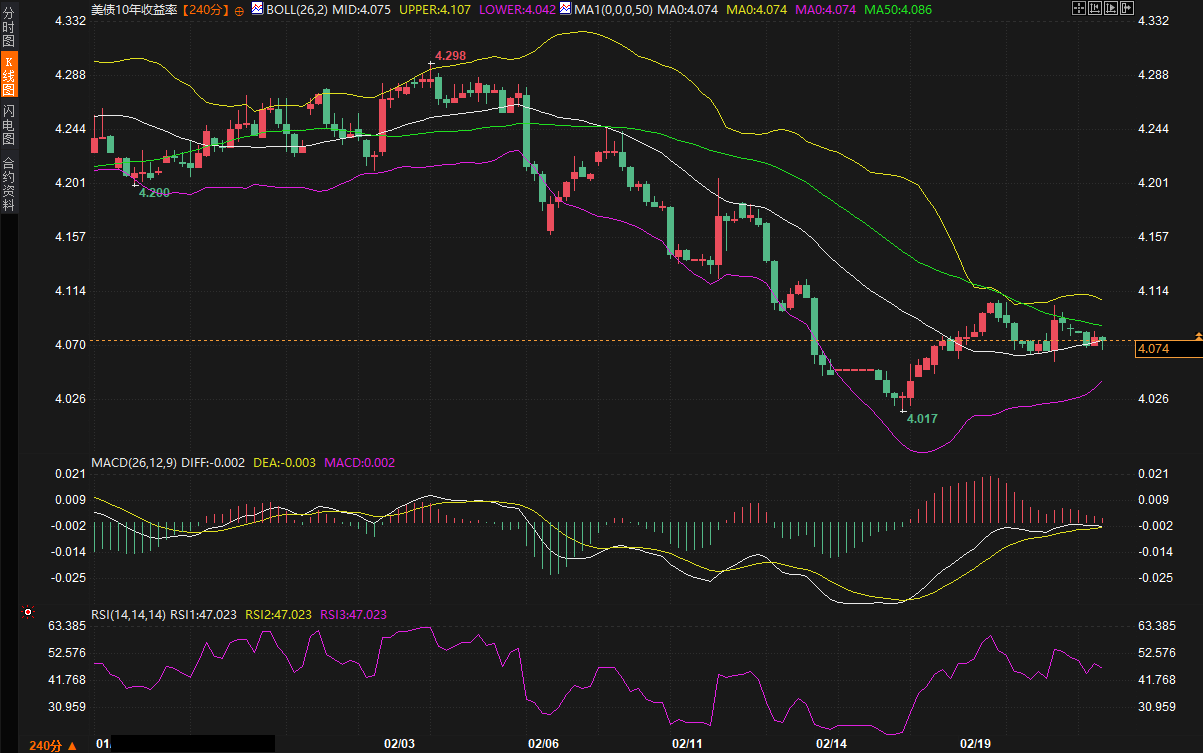
Analyzing the transmission mechanism of the US Treasury market, the fluctuations in the current dollar trend are highly correlated with the pace of recovery in US Treasury yields. According to the 240-minute candlestick chart, the 10-year US Treasury yield is currently in a consolidation phase after a sharp decline, with the latest quote of 4.074% near the Bollinger Band middle line (4.075%). Technically, the MACD histogram has turned positive, indicating that the downward momentum has been fully released and short-term rebound momentum is accumulating. However, the RSI remains in the neutral range of 47.02, showing that market sentiment remains relatively balanced, and a clear trend signal has not yet emerged.
It's worth noting that analysts from well-known institutions point out that the market's initial reaction to the ruling was more of an emotionally driven "knee-jerk" fluctuation than a fundamental shift in the global economic landscape. The tariff policy still has the potential to be maintained through other legal means, meaning the future trend of the US dollar will be highly dependent on the direction of the US Treasury yield breakout. If the 10-year US Treasury yield can hold above the 4.086% MA50 moving average, the US dollar index is expected to find medium-term support; conversely, if it falls below the lower Bollinger Band at 4.042%, the US dollar may face a new round of downward pressure.
Spot gold has exhibited typical characteristics of a safe-haven asset in this round of market activity. Spot gold was trading around $5162 per ounce, having reached a high of $5176 during the session, up more than 1% from Friday's close. From a transmission perspective, the rise in gold prices is doubly linked to the US Treasury market: on the one hand, the low and volatile US Treasury yields have reduced the cost of holding gold; on the other hand, the safe-haven demand triggered by policy uncertainty has directly boosted the allocation value of gold.
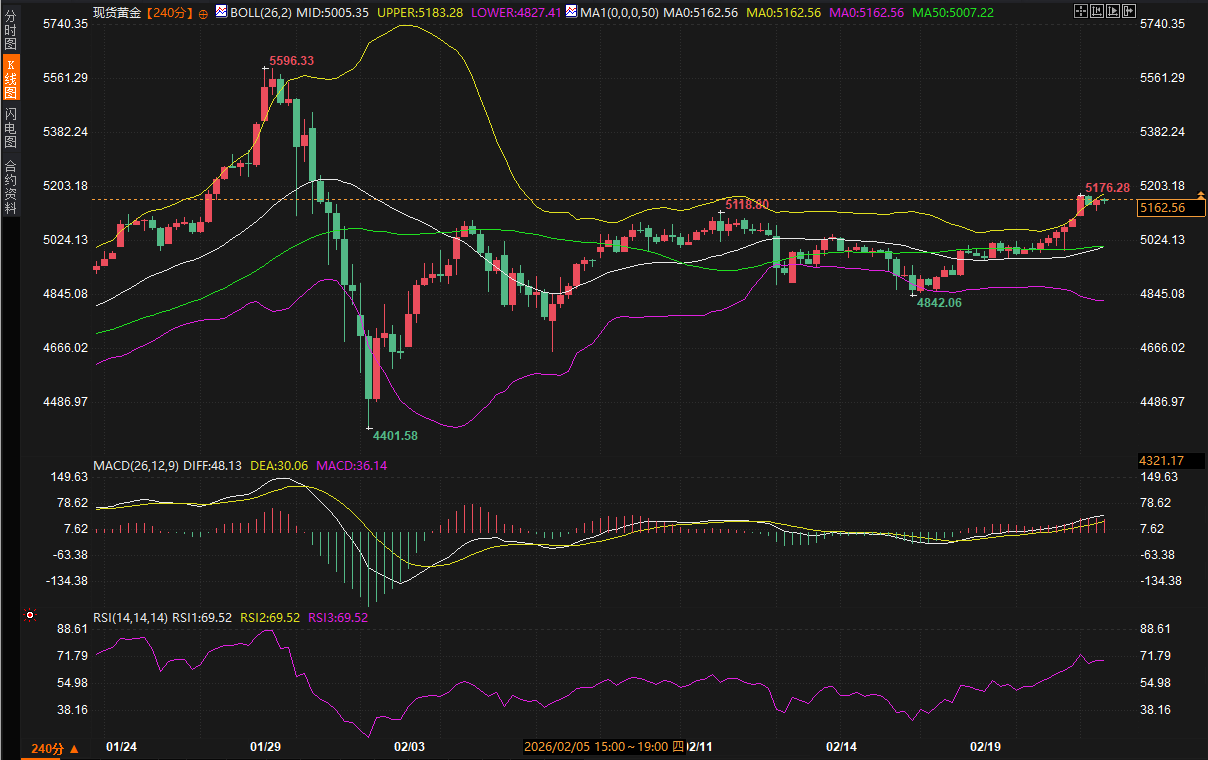
From a 240-minute technical chart perspective, gold is currently in a clear short-term uptrend. After hitting a low of $4842 on February 14th, gold prices have closed higher for several consecutive days, steadily rising along the Bollinger Band's middle line, and have now broken through the previous consolidation high of $5118. The Bollinger Bands indicator shows the upper band at $5183 and the middle band support at $5005. The current price is approaching the upper band area, indicating short-term technical overbought pressure. The RSI indicator is 69.52, close to the overbought threshold of 70. Although the MACD histogram continues to expand, it is approaching the peak level corresponding to the previous high, suggesting that upward momentum may gradually weaken.
Unlike conventional analysis, the safe-haven effect of gold in this round is largely achieved through the bond market transmission mechanism. Market concerns about the Middle East geopolitical situation—especially the tensions between the US and Iran—are strengthening investor demand for traditional safe-haven assets. A well-known investment bank analysis points out that the potential oil price shocks triggered by geopolitical conflicts will impact inflation expectations, and gold's value as an inflation hedge is being reassessed. The simultaneous strengthening of the Swiss franc (up 0.3% to 0.7736) also indirectly confirms the rising demand for safe-haven assets.
Over the next 2-3 trading days, the gold market will face a dual battle between technical and fundamental factors. From a technical perspective, spot gold has entered a key resistance zone on the 240-minute chart: the upper Bollinger Band at $5183 forms immediate short-term resistance; a break above this level could lead to further gains towards previous highs. However, momentum indicators show the RSI approaching overbought levels, and while the MACD histogram is expanding, its rate of increase is slowing, suggesting a potential short-term technical pullback. Support below should be watched for a possible retest of the middle Bollinger Band at $5005.
Regarding US Treasury yields, the market is currently at a critical juncture of balance between bulls and bears. The 10-year Treasury yield is fluctuating between 4.05% and 4.11%, with the market awaiting a clear breakout signal. Looking at market performance, although risk aversion initially drove bond prices higher, the gains subsequently narrowed, indicating that the market remains divided in pricing policy uncertainty. Leading institutions believe that the upcoming days will be crucial for monitoring the flurry of speeches by Federal Reserve officials, as any signals regarding the policy path could trigger a breakout in US Treasury yields.
The US dollar index's movement is more complex. Despite short-term pressure from policy uncertainty, the technical structure shows that the dollar index remains in a range-bound pattern between 96.49 and 98.06. The current price of 97.83 is between the Bollinger Band middle line (97.59) and the upper line (98.17). Although the MACD histogram has shortened, the DIFF line remains below the DEA line, indicating a short-term bearish momentum. If it fails to break through the recent high of 98.06 in the coming days, it may retest the lower Bollinger Band support at 97.01.
Looking ahead to the next 2-3 trading days, the market's core focus will revolve around three aspects: First, the subsequent development of US tariff policy, especially whether Trump will maintain tariff measures through other executive means; second, the evolution of the US-Iran situation, with Thursday's nuclear negotiations serving as a key observation window; and third, the flurry of statements from Federal Reserve officials, from which the market will seek further guidance on the interest rate path.
For gold, short-term caution is warranted regarding the risk of a technical correction, but in the medium term, the safe-haven demand stemming from policy uncertainty and geopolitical tensions still has room to be released. If it can hold above $5160, it may test higher levels within a range; if it falls below this level, it may retrace to the $5000 mark for support. Regarding US Treasury yields, the key focus is on the 4.086% MA50 moving average; holding above this level could extend the rebound, while a failure to hold could restart the downtrend. The US dollar index's range-bound trading pattern is unlikely to break in the short term, with the 97-98.40 range remaining the core trading range.
Overall, the core contradiction in the current market lies in balancing the safe-haven demand driven by policy uncertainty with overbought technical pressure. Investors need to closely monitor the direction of the US Treasury yield breakout, as this will directly determine the next stage of the dollar and gold's price movement.
Tariff rulings impact the dollar; US Treasury yields become a key variable.
The U.S. Supreme Court's ruling last Friday that Trump's previous comprehensive tariff measures exceeded executive authority directly triggered a risk-averse market reaction after Monday's opening. The dollar index fell to 97.36 in early Asian trading, and although it subsequently recovered some ground to around 97.83, from a technical perspective, market concerns about policy uncertainty have not completely dissipated.
Analyzing the transmission mechanism of the US Treasury market, the fluctuations in the current dollar trend are highly correlated with the pace of recovery in US Treasury yields. According to the 240-minute candlestick chart, the 10-year US Treasury yield is currently in a consolidation phase after a sharp decline, with the latest quote of 4.074% near the Bollinger Band middle line (4.075%). Technically, the MACD histogram has turned positive, indicating that the downward momentum has been fully released and short-term rebound momentum is accumulating. However, the RSI remains in the neutral range of 47.02, showing that market sentiment remains relatively balanced, and a clear trend signal has not yet emerged.
It's worth noting that analysts from well-known institutions point out that the market's initial reaction to the ruling was more of an emotionally driven "knee-jerk" fluctuation than a fundamental shift in the global economic landscape. The tariff policy still has the potential to be maintained through other legal means, meaning the future trend of the US dollar will be highly dependent on the direction of the US Treasury yield breakout. If the 10-year US Treasury yield can hold above the 4.086% MA50 moving average, the US dollar index is expected to find medium-term support; conversely, if it falls below the lower Bollinger Band at 4.042%, the US dollar may face a new round of downward pressure.
Gold breaks through technical resistance, strengthening the safe-haven logic transmitted through the bond market.
Spot gold has exhibited typical characteristics of a safe-haven asset in this round of market activity. Spot gold was trading around $5162 per ounce, having reached a high of $5176 during the session, up more than 1% from Friday's close. From a transmission perspective, the rise in gold prices is doubly linked to the US Treasury market: on the one hand, the low and volatile US Treasury yields have reduced the cost of holding gold; on the other hand, the safe-haven demand triggered by policy uncertainty has directly boosted the allocation value of gold.
From a 240-minute technical chart perspective, gold is currently in a clear short-term uptrend. After hitting a low of $4842 on February 14th, gold prices have closed higher for several consecutive days, steadily rising along the Bollinger Band's middle line, and have now broken through the previous consolidation high of $5118. The Bollinger Bands indicator shows the upper band at $5183 and the middle band support at $5005. The current price is approaching the upper band area, indicating short-term technical overbought pressure. The RSI indicator is 69.52, close to the overbought threshold of 70. Although the MACD histogram continues to expand, it is approaching the peak level corresponding to the previous high, suggesting that upward momentum may gradually weaken.
Unlike conventional analysis, the safe-haven effect of gold in this round is largely achieved through the bond market transmission mechanism. Market concerns about the Middle East geopolitical situation—especially the tensions between the US and Iran—are strengthening investor demand for traditional safe-haven assets. A well-known investment bank analysis points out that the potential oil price shocks triggered by geopolitical conflicts will impact inflation expectations, and gold's value as an inflation hedge is being reassessed. The simultaneous strengthening of the Swiss franc (up 0.3% to 0.7736) also indirectly confirms the rising demand for safe-haven assets.
The interplay between technical pressure and fundamental support
Over the next 2-3 trading days, the gold market will face a dual battle between technical and fundamental factors. From a technical perspective, spot gold has entered a key resistance zone on the 240-minute chart: the upper Bollinger Band at $5183 forms immediate short-term resistance; a break above this level could lead to further gains towards previous highs. However, momentum indicators show the RSI approaching overbought levels, and while the MACD histogram is expanding, its rate of increase is slowing, suggesting a potential short-term technical pullback. Support below should be watched for a possible retest of the middle Bollinger Band at $5005.
Regarding US Treasury yields, the market is currently at a critical juncture of balance between bulls and bears. The 10-year Treasury yield is fluctuating between 4.05% and 4.11%, with the market awaiting a clear breakout signal. Looking at market performance, although risk aversion initially drove bond prices higher, the gains subsequently narrowed, indicating that the market remains divided in pricing policy uncertainty. Leading institutions believe that the upcoming days will be crucial for monitoring the flurry of speeches by Federal Reserve officials, as any signals regarding the policy path could trigger a breakout in US Treasury yields.
The US dollar index's movement is more complex. Despite short-term pressure from policy uncertainty, the technical structure shows that the dollar index remains in a range-bound pattern between 96.49 and 98.06. The current price of 97.83 is between the Bollinger Band middle line (97.59) and the upper line (98.17). Although the MACD histogram has shortened, the DIFF line remains below the DEA line, indicating a short-term bearish momentum. If it fails to break through the recent high of 98.06 in the coming days, it may retest the lower Bollinger Band support at 97.01.
Future Trend Outlook
Looking ahead to the next 2-3 trading days, the market's core focus will revolve around three aspects: First, the subsequent development of US tariff policy, especially whether Trump will maintain tariff measures through other executive means; second, the evolution of the US-Iran situation, with Thursday's nuclear negotiations serving as a key observation window; and third, the flurry of statements from Federal Reserve officials, from which the market will seek further guidance on the interest rate path.
For gold, short-term caution is warranted regarding the risk of a technical correction, but in the medium term, the safe-haven demand stemming from policy uncertainty and geopolitical tensions still has room to be released. If it can hold above $5160, it may test higher levels within a range; if it falls below this level, it may retrace to the $5000 mark for support. Regarding US Treasury yields, the key focus is on the 4.086% MA50 moving average; holding above this level could extend the rebound, while a failure to hold could restart the downtrend. The US dollar index's range-bound trading pattern is unlikely to break in the short term, with the 97-98.40 range remaining the core trading range.
Overall, the core contradiction in the current market lies in balancing the safe-haven demand driven by policy uncertainty with overbought technical pressure. Investors need to closely monitor the direction of the US Treasury yield breakout, as this will directly determine the next stage of the dollar and gold's price movement.
- Risk Warning and Disclaimer
- The market involves risk, and trading may not be suitable for all investors. This article is for reference only and does not constitute personal investment advice, nor does it take into account certain users’ specific investment objectives, financial situation, or other needs. Any investment decisions made based on this information are at your own risk.