


With the near-month premium reaching $3.5, is crude oil entering its final frenzy?
2026-02-24 20:29:10
On Tuesday, February 24th, before the US market opened, US crude oil experienced a subtle "step back and the sky will be clear" scenario. Prices faced slight resistance around $66.50, but this wasn't a trend collapse; rather, it resembled a deep breath within the nearly six-month high range. Not far above, the previous high of $67.28 acted as an invisible ceiling, suppressing bullish momentum; below, a strong support network held back profit-taking selling pressure. The market is currently in a delicate rebalancing state: on one side, a chilly macroeconomic environment; on the other, the raging geopolitical fire.

The US dollar index rose 0.15% to 97.85 during the day, demonstrating its strength as a natural nemesis of dollar-denominated commodities. Normally, a stronger dollar suffocates oil prices, but in the current situation, it acts more like a rhythm regulator, amplifying price volatility without single-handedly reversing the upward trend driven by geopolitical risks. For oil prices to break through this resistance, they must rely on a stronger risk premium to offset the pressure from exchange rates; otherwise, they will likely remain in a tug-of-war around previous highs, playing a cat-and-mouse game.
The core logic supporting the continued strength of oil prices remains inextricably linked to the uncertainties of the Middle East. Market attention is focused on the disagreements surrounding Iran's nuclear program and its potential spillover risks. The US has taken a hard line, with President Trump publicly pressuring through Truth.Social, warning of severe consequences if no agreement is reached. While these statements haven't directly cut off oil supplies, they have significantly increased the market's pricing weight of "tail risks," forcing funds to pay a premium for protective long positions. The real deciding factor lies in the second round of US-Iran talks scheduled for Thursday. If the talks signal escalating tensions, especially regarding risks to transportation routes, the upward potential of oil prices will be ignited instantly; conversely, if signs of easing emerge, the accumulated risk premium will be quickly reversed, and oil prices may fall from their highs, returning to fundamentals.
Commerzbank analysis points out that the biggest variable in the current oil market lies in the potential for a military strike that could cause a sudden disruption to supply. Brent crude has risen by about 10% since early February to around $72, significantly higher than its estimated fair value of $66. This excess reflects the market's pricing in fears of war. However, the market also maintains a degree of rationality: some OPEC oil-producing countries still have spare capacity, and Saudi Arabia, Iraq, and other countries could theoretically increase production to fill the gap. But the real Achilles' heel lies in the Strait of Hormuz. Last week's military exercises restricted the waterway for several hours, which should be enough to warn the market: if this global energy artery is blocked for a long period, even with ample spare capacity, it will not solve the fatal problem of restricted transportation and exports. Land pipeline detour capacity is limited and nearing its limit, meaning the longer the disruption lasts, the faster inventories will decline, leading to fierce competition in the spot market and a dramatic surge in near-month prices.
Market panic and expectations are already clearly reflected in the changes in the term structure. Over the past three weeks, as the risk of escalating conflict has been incorporated into pricing, the time spread of the Brent forward curve has widened significantly. Last Friday, the premium of the one-month contract relative to the seven-month contract reached as high as $3.50. This "inverse market" pattern clearly indicates that traders are willing to pay a high price for readily available crude oil because they are extremely worried about short-term supply shortages or disruptions in the transportation chain. Returning to the technical pattern of US crude oil, the price entered a consolidation phase after reaching a high of $67.28, and is currently in a sensitive area at $66.50. Indicators show that the MACD DIFF is around 1.36, DEA around 1.23, and the histogram around 0.28, indicating a slightly bullish pattern, but the momentum has not accelerated, as if waiting for new incremental information to break the deadlock; the RSI reading is around 61.72, in a slightly bullish but not extremely crowded state, consistent with the characteristics of high-level consolidation awaiting event-driven developments.
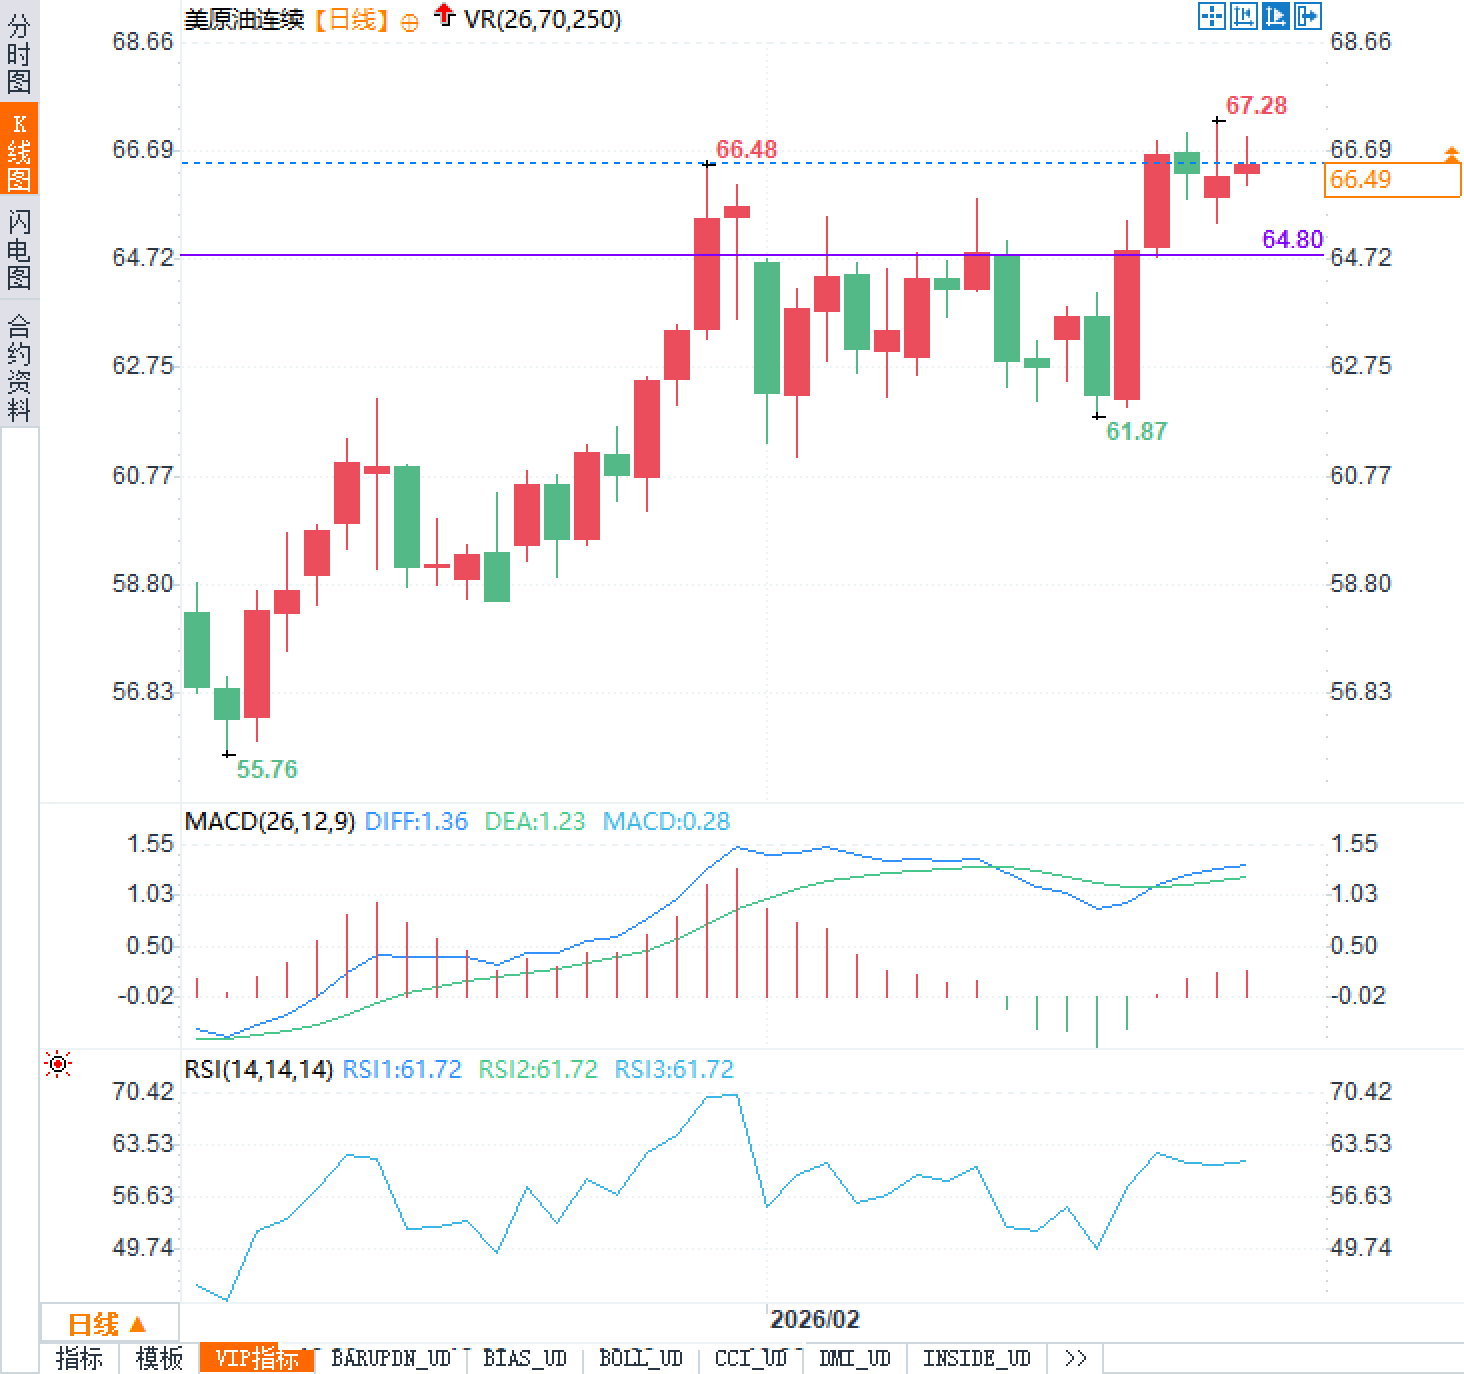
In summary, oil prices are currently caught in a fierce struggle between macroeconomic pricing pressures and a strong geopolitical risk premium. The area around $67.28 is a stress test zone for sentiment and risk premium; a break and hold above this level would redefine the high-level range. Meanwhile, the $64.80 level is a key support level for easing risk; a breach of this level could lead to a retest of $61.87. The outcome of Thursday's talks will be crucial in determining the future: will the risk premium continue to expand, pushing prices to new heights, or will the bubble burst and prices return to calm?
The US dollar index rose 0.15% to 97.85 during the day, demonstrating its strength as a natural nemesis of dollar-denominated commodities. Normally, a stronger dollar suffocates oil prices, but in the current situation, it acts more like a rhythm regulator, amplifying price volatility without single-handedly reversing the upward trend driven by geopolitical risks. For oil prices to break through this resistance, they must rely on a stronger risk premium to offset the pressure from exchange rates; otherwise, they will likely remain in a tug-of-war around previous highs, playing a cat-and-mouse game.
The Middle East Powder Keg: From Verbal Pressure to the Lifeline of Shipping
The core logic supporting the continued strength of oil prices remains inextricably linked to the uncertainties of the Middle East. Market attention is focused on the disagreements surrounding Iran's nuclear program and its potential spillover risks. The US has taken a hard line, with President Trump publicly pressuring through Truth.Social, warning of severe consequences if no agreement is reached. While these statements haven't directly cut off oil supplies, they have significantly increased the market's pricing weight of "tail risks," forcing funds to pay a premium for protective long positions. The real deciding factor lies in the second round of US-Iran talks scheduled for Thursday. If the talks signal escalating tensions, especially regarding risks to transportation routes, the upward potential of oil prices will be ignited instantly; conversely, if signs of easing emerge, the accumulated risk premium will be quickly reversed, and oil prices may fall from their highs, returning to fundamentals.
Commerzbank analysis points out that the biggest variable in the current oil market lies in the potential for a military strike that could cause a sudden disruption to supply. Brent crude has risen by about 10% since early February to around $72, significantly higher than its estimated fair value of $66. This excess reflects the market's pricing in fears of war. However, the market also maintains a degree of rationality: some OPEC oil-producing countries still have spare capacity, and Saudi Arabia, Iraq, and other countries could theoretically increase production to fill the gap. But the real Achilles' heel lies in the Strait of Hormuz. Last week's military exercises restricted the waterway for several hours, which should be enough to warn the market: if this global energy artery is blocked for a long period, even with ample spare capacity, it will not solve the fatal problem of restricted transportation and exports. Land pipeline detour capacity is limited and nearing its limit, meaning the longer the disruption lasts, the faster inventories will decline, leading to fierce competition in the spot market and a dramatic surge in near-month prices.
Hidden clues in the technical analysis: The battle between bulls and bears amid dramatic changes in the term structure
Market panic and expectations are already clearly reflected in the changes in the term structure. Over the past three weeks, as the risk of escalating conflict has been incorporated into pricing, the time spread of the Brent forward curve has widened significantly. Last Friday, the premium of the one-month contract relative to the seven-month contract reached as high as $3.50. This "inverse market" pattern clearly indicates that traders are willing to pay a high price for readily available crude oil because they are extremely worried about short-term supply shortages or disruptions in the transportation chain. Returning to the technical pattern of US crude oil, the price entered a consolidation phase after reaching a high of $67.28, and is currently in a sensitive area at $66.50. Indicators show that the MACD DIFF is around 1.36, DEA around 1.23, and the histogram around 0.28, indicating a slightly bullish pattern, but the momentum has not accelerated, as if waiting for new incremental information to break the deadlock; the RSI reading is around 61.72, in a slightly bullish but not extremely crowded state, consistent with the characteristics of high-level consolidation awaiting event-driven developments.
In summary, oil prices are currently caught in a fierce struggle between macroeconomic pricing pressures and a strong geopolitical risk premium. The area around $67.28 is a stress test zone for sentiment and risk premium; a break and hold above this level would redefine the high-level range. Meanwhile, the $64.80 level is a key support level for easing risk; a breach of this level could lead to a retest of $61.87. The outcome of Thursday's talks will be crucial in determining the future: will the risk premium continue to expand, pushing prices to new heights, or will the bubble burst and prices return to calm?
- Risk Warning and Disclaimer
- The market involves risk, and trading may not be suitable for all investors. This article is for reference only and does not constitute personal investment advice, nor does it take into account certain users’ specific investment objectives, financial situation, or other needs. Any investment decisions made based on this information are at your own risk.
