Is there a unanimous bearish sentiment towards the US dollar? Resilience lies beneath the market consensus.
2026-02-24 20:53:51
Since the beginning of 2026, the US dollar index has once again come under pressure, which is mainly attributed by the market to a structural loss of confidence in the US dollar, US Treasury bonds, and US stocks.
The market is almost unanimously in favor of selling the US dollar, but as mentioned in a previous article, I am bullish on the dollar. ING's latest report on the US dollar index also suggests that the dollar may be stronger than expected.
This article explores that although the long-term trend of gradual de-dollarization has continued for decades, the core driving force behind the decline of the US dollar index in 2026 may still be cyclical factors, and may not represent a structural collapse of the dollar system.
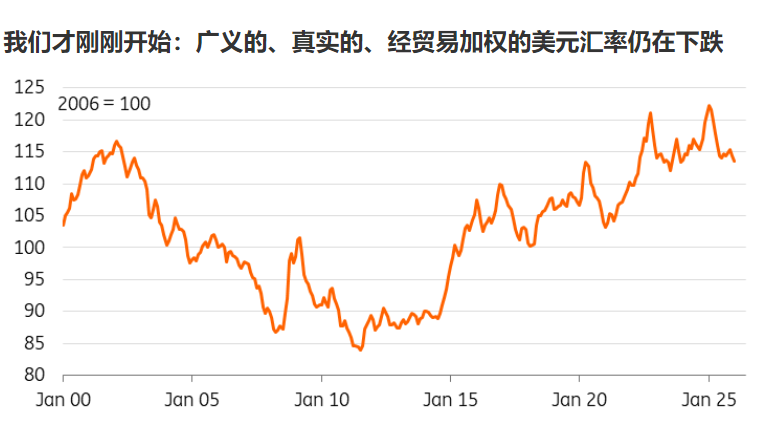
From a historical perspective, the current US dollar index is by no means in a truly "weak" range.
The core benchmark for judging the true strength of the US dollar index is the trade-weighted real exchange rate adjusted relative to the consumer price level, rather than simply the fluctuation of the nominal exchange rate.
Data from the Federal Reserve on the real exchange rates of the US dollar against 26 major trading partners shows that even after last year's correction, the cumulative increase of 45% since 2011 has not been substantially shaken.
This background also explains the heated discussion in the market last year about the Mar-a-Lago Agreement putting pressure on the dollar—at that time, Washington was trying to use exchange rate adjustments to smooth out global competition price differences for American manufacturing.
Clearly, the US dollar index is still at a historically high level. If the fundamentals support it, it still has ample room to fall, and this round of decline has only just begun.
The adjustment of foreign exchange hedging strategies by overseas investors is a key funding factor driving the cyclical weakening of the US dollar index.
Hedging operations by buy-side institutions have always been a core flow of funds influencing foreign exchange market fluctuations. Last April, the sharp drop in the US dollar index but the resilience of US stocks and bonds made cross-border portfolio exchange rate hedging strategies a market focus.
A study by the Bank for International Settlements at the time indicated that Asian investors played a key role in this process, although Federal Reserve Chairman Jerome Powell expressed reservations about the conclusion.
High dollar hedging costs have previously suppressed investors' hedging ratios, especially considering the euro-dollar hedging data, which showed that institutions were generally in a low-hedge state at the beginning of last year.
At the time, the market consensus was that the tariff policy would severely damage the currencies of the United States' trading partners and that the US dollar index would continue to strengthen. However, this judgment ultimately deviated significantly from the actual market performance.
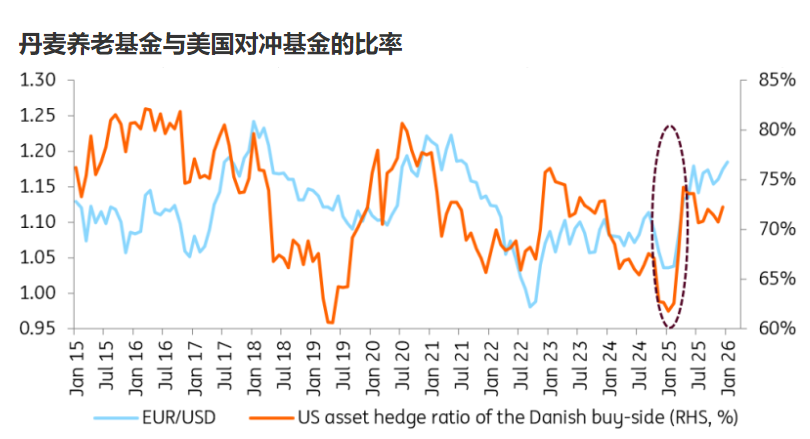
Data on hedging by domestic pension funds and asset management institutions disclosed by the Danish central bank provides a scarce sample for observing buy-side behavior.
Data shows that the dollar hedging ratio was 72% at the end of last year, and the data for January 2026 will be released in early March.
The baseline expectation is that the Federal Reserve will cut interest rates by 50 basis points this year while the European Central Bank will remain on hold. This policy divergence will further compress the cost of hedging the dollar, and the hedging ratio is expected to rise to 74% by the end of the year. This means that subsequent dollar selling will continue to be released, putting sustained pressure on the dollar index.
However, the over-hedged scenario with a hedging ratio of 80%-82% is not yet included in the baseline expectation. This scenario would require a sharp decline in market confidence in the US dollar, which is currently considered unlikely.
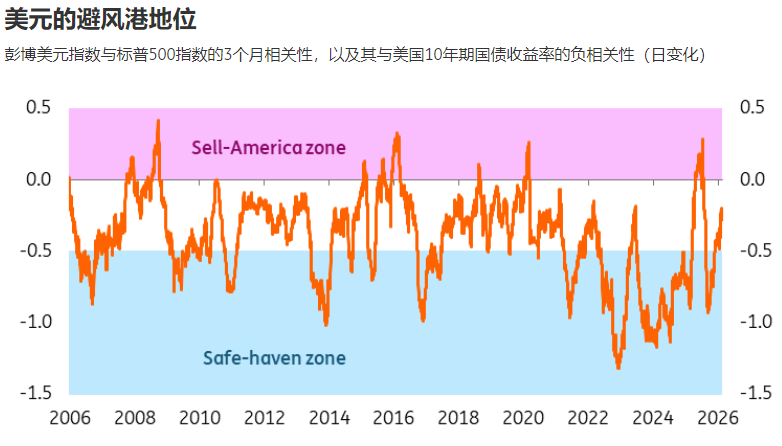
The safe-haven premium of the US dollar index has also shrunk significantly, but this change is still a cyclical fluctuation and does not show a structural shift.
The risk-averse nature of the dollar index can be characterized by the difference in the 3-month correlation coefficient between the Bloomberg Dollar Index, the S&P 500 Index, and the 10-year Treasury yield: the higher the negative value of this indicator, the stronger the risk-averse performance of the dollar index when the stock market falls and long-term yields rise.
In terms of actual data, the three-month correlation coefficient between the US dollar and the S&P 500 index is -0.25. Although the negative value is weaker than the historical average, it is still statistically significant, indicating that the safe-haven attribute of the US dollar has not completely disappeared.
Looking back at historical trends, the US dollar index has lost its defensive currency characteristics at several stages, so theoretically, we cannot hastily define this shrinkage of the safe-haven premium as a structural shift.
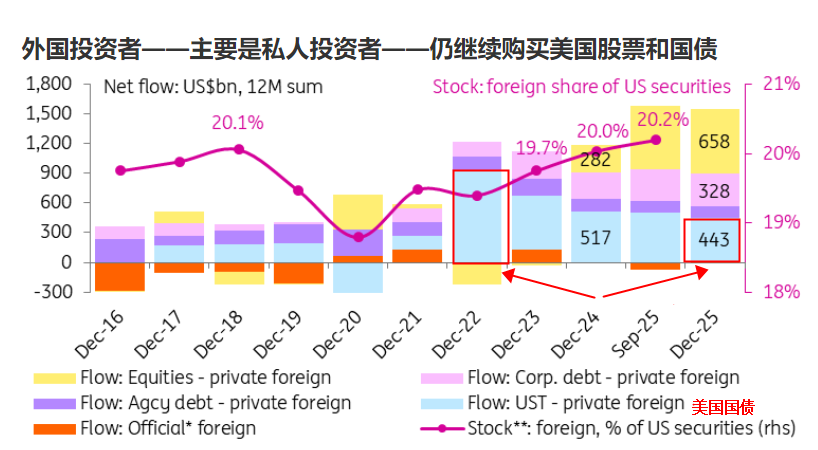
Funding data shows that foreign funds have not withdrawn from US assets, but the structure has undergone significant changes.
Private investors account for over 80% of the funds holding US securities overseas, remaining the core force supporting US Treasury bonds and US stocks.
Its annual net purchases climbed from an average of $1 trillion per year (an average of $88 billion per month) in 2022-2024 to $1.5 trillion (an average of $128 billion per month) in 2025, mainly allocated to US stocks, US bonds and credit bonds.
As of September 2025, foreign investors are projected to hold 20.2% of all U.S. securities, a near-decade high.
However, it can be seen that the holdings of US Treasury bonds have decreased significantly, while the holdings of US stocks have increased. This is important, indicating that stable foreign funds are withdrawing, while risky funds are pouring in. This suggests that large funds may be worried about the exchange rate and other risks associated with allocating too much US Treasury bonds. The strong performance of US stocks and the narrative surrounding US AI have attracted many foreign risky assets. Whether these assets remain in the US and the performance of the US equity market may be highly correlated.
Foreign official investors (central banks, sovereign wealth funds, and governments) have maintained relatively stable holdings of US assets since 2020. Although their attitude remains cautious, it is a significant improvement compared to the reduction phase before 2020. However, their influence in foreign holdings is continuing to weaken.
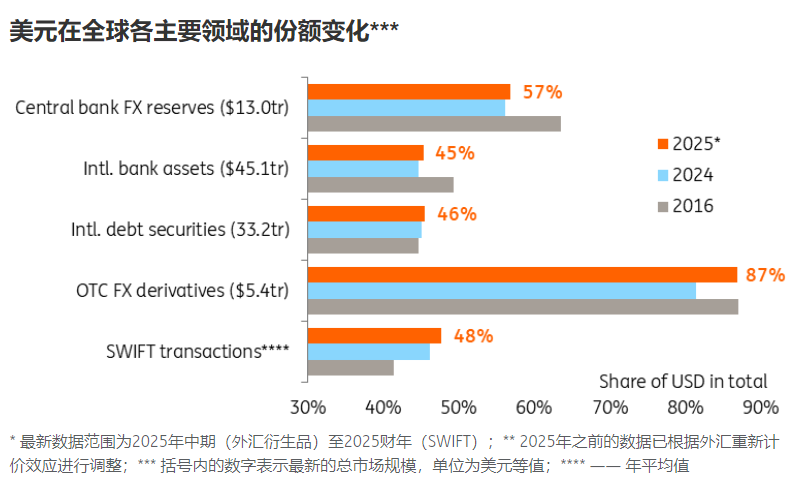
From the perspective of the global monetary system, the process of de-dollarization is evident, but the structural status of the dollar has not yet been substantially eroded.
Looking at the core structural indicators of the US dollar in global assets, liabilities, foreign exchange transactions, and cross-border settlements, there has been some contraction since 2024 compared to 2026.
According to the latest COFER data from the IMF, the US dollar will account for 56.9% of global foreign exchange reserves in the third quarter of 2025, slightly higher than the level at the end of 2024 after adjusting for exchange rates. The overall fluctuation in the proportion is mostly driven by exchange rate valuation, rather than by the central bank's active portfolio adjustments.
By mid-2025, the US dollar will account for 86.8% of transactions in the over-the-counter foreign exchange market. After exchange rate adjustments, this figure may rebound compared to 2024, but it will still be weaker than in 2026.
The core of "American exceptionalism" is the relative attractiveness of American assets compared to other parts of the world. Since the second half of last year, the market has begun to price in the first synchronized global recovery after the pandemic, the Russia-Ukraine conflict, and tariff shocks, and expectations for global economic resilience have continued to rise.
Against this backdrop, a rebound in global risk appetite has driven funds to pro-cyclical assets such as emerging markets, with the cumulative inflow of funds into two leading emerging market stock ETFs reaching its fastest growth rate in more than a decade.
Such capital migration is naturally bearish for the US dollar index. In essence, besides the weakening of the dollar's fundamentals, it is also due to the emergence of more cost-effective investment opportunities in overseas markets.
To predict future market trends, it is crucial to monitor four key indicators to anticipate potential additional pressure on the US dollar index from weakening demand for US Treasury bonds overseas:
Widening swap spreads and concentrated selling of US Treasuries by overseas entities will push up the yield on US Treasuries relative to the SOFR rate.
The yield curve has steepened significantly, especially the 5/10-year and 5/30-year curves, making it easy for long-term yields to decouple from valuations.
The sharp decline in indirect bidding data at US Treasury auctions confirms the pressure on official funds to reduce their holdings.
Although the current weakening of the US dollar index is driven by cyclical factors, two major risks that could trigger a structural sell-off still need to be noted.
Excluding the extreme scenario of the US implementing capital controls, the biggest risk this year is the independence of the Federal Reserve—if the market interprets this as the Fed being forced to cut interest rates inappropriately, the dollar index may experience a panic sell-off, corresponding to a return of US real interest rates to negative territory.
Another core risk is the US fiscal fundamentals. The persistently high deficit coupled with the massive issuance of US Treasury bonds will erode the core logic of the US dollar as a "safe asset." If this is compounded by a continued decline in foreign participation, the probability of a structural revaluation of the US dollar index will surge significantly.
Overall, the outlook for the US dollar index in 2026 remains bearish. Declining short-term interest rates (expected to be followed by two Fed rate cuts this year) will drive continued dollar hedging. Slower US economic growth in the second half of the year, coupled with improving Eurozone data, will jointly suppress the dollar exchange rate (the euro has a 57.6% weighting in the dollar index, playing a decisive role in its movement).
Ultimately, the weakening of the US dollar index in 2026 is a combined result of global economic cycle divergence, policy pace differences, and capital reallocation; the structural foundation of the dollar system remains unshaken. In this process, it is crucial to distinguish between cyclical fluctuations and structural changes, and to accurately grasp policy shifts and capital flow signals in order to seize investment opportunities amidst the volatility of the US dollar index.
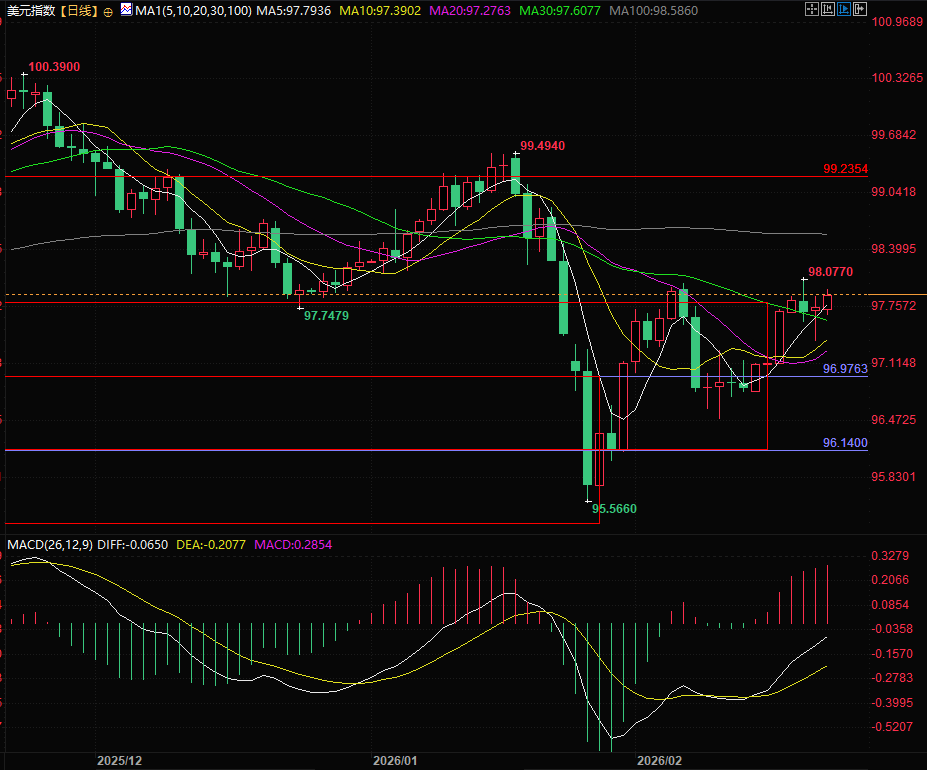
(US Dollar Index Daily Chart, Source: FX678)
At 20:25 Beijing time, the US dollar index is currently at 97.91.
The market is almost unanimously in favor of selling the US dollar, but as mentioned in a previous article, I am bullish on the dollar. ING's latest report on the US dollar index also suggests that the dollar may be stronger than expected.
This article explores that although the long-term trend of gradual de-dollarization has continued for decades, the core driving force behind the decline of the US dollar index in 2026 may still be cyclical factors, and may not represent a structural collapse of the dollar system.
The US dollar index is not truly weak and remains in historically high ranges.
From a historical perspective, the current US dollar index is by no means in a truly "weak" range.
The core benchmark for judging the true strength of the US dollar index is the trade-weighted real exchange rate adjusted relative to the consumer price level, rather than simply the fluctuation of the nominal exchange rate.
Data from the Federal Reserve on the real exchange rates of the US dollar against 26 major trading partners shows that even after last year's correction, the cumulative increase of 45% since 2011 has not been substantially shaken.
This background also explains the heated discussion in the market last year about the Mar-a-Lago Agreement putting pressure on the dollar—at that time, Washington was trying to use exchange rate adjustments to smooth out global competition price differences for American manufacturing.
Clearly, the US dollar index is still at a historically high level. If the fundamentals support it, it still has ample room to fall, and this round of decline has only just begun.
Adjusting Hedging Strategies: The Core Funding Logic Behind the Continued Release of Dollar Selling Pressure
The adjustment of foreign exchange hedging strategies by overseas investors is a key funding factor driving the cyclical weakening of the US dollar index.
Hedging operations by buy-side institutions have always been a core flow of funds influencing foreign exchange market fluctuations. Last April, the sharp drop in the US dollar index but the resilience of US stocks and bonds made cross-border portfolio exchange rate hedging strategies a market focus.
A study by the Bank for International Settlements at the time indicated that Asian investors played a key role in this process, although Federal Reserve Chairman Jerome Powell expressed reservations about the conclusion.
High dollar hedging costs have previously suppressed investors' hedging ratios, especially considering the euro-dollar hedging data, which showed that institutions were generally in a low-hedge state at the beginning of last year.
At the time, the market consensus was that the tariff policy would severely damage the currencies of the United States' trading partners and that the US dollar index would continue to strengthen. However, this judgment ultimately deviated significantly from the actual market performance.
Data on hedging by domestic pension funds and asset management institutions disclosed by the Danish central bank provides a scarce sample for observing buy-side behavior.
Data shows that the dollar hedging ratio was 72% at the end of last year, and the data for January 2026 will be released in early March.
The baseline expectation is that the Federal Reserve will cut interest rates by 50 basis points this year while the European Central Bank will remain on hold. This policy divergence will further compress the cost of hedging the dollar, and the hedging ratio is expected to rise to 74% by the end of the year. This means that subsequent dollar selling will continue to be released, putting sustained pressure on the dollar index.
However, the over-hedged scenario with a hedging ratio of 80%-82% is not yet included in the baseline expectation. This scenario would require a sharp decline in market confidence in the US dollar, which is currently considered unlikely.
Its safe-haven appeal has diminished, but it still exhibits cyclical fluctuations.
The safe-haven premium of the US dollar index has also shrunk significantly, but this change is still a cyclical fluctuation and does not show a structural shift.
The risk-averse nature of the dollar index can be characterized by the difference in the 3-month correlation coefficient between the Bloomberg Dollar Index, the S&P 500 Index, and the 10-year Treasury yield: the higher the negative value of this indicator, the stronger the risk-averse performance of the dollar index when the stock market falls and long-term yields rise.
In terms of actual data, the three-month correlation coefficient between the US dollar and the S&P 500 index is -0.25. Although the negative value is weaker than the historical average, it is still statistically significant, indicating that the safe-haven attribute of the US dollar has not completely disappeared.
Looking back at historical trends, the US dollar index has lost its defensive currency characteristics at several stages, so theoretically, we cannot hastily define this shrinkage of the safe-haven premium as a structural shift.
Foreign funds have not withdrawn, but their structure has undergone significant changes.
Funding data shows that foreign funds have not withdrawn from US assets, but the structure has undergone significant changes.
Private investors account for over 80% of the funds holding US securities overseas, remaining the core force supporting US Treasury bonds and US stocks.
Its annual net purchases climbed from an average of $1 trillion per year (an average of $88 billion per month) in 2022-2024 to $1.5 trillion (an average of $128 billion per month) in 2025, mainly allocated to US stocks, US bonds and credit bonds.
As of September 2025, foreign investors are projected to hold 20.2% of all U.S. securities, a near-decade high.
However, it can be seen that the holdings of US Treasury bonds have decreased significantly, while the holdings of US stocks have increased. This is important, indicating that stable foreign funds are withdrawing, while risky funds are pouring in. This suggests that large funds may be worried about the exchange rate and other risks associated with allocating too much US Treasury bonds. The strong performance of US stocks and the narrative surrounding US AI have attracted many foreign risky assets. Whether these assets remain in the US and the performance of the US equity market may be highly correlated.
Foreign official investors (central banks, sovereign wealth funds, and governments) have maintained relatively stable holdings of US assets since 2020. Although their attitude remains cautious, it is a significant improvement compared to the reduction phase before 2020. However, their influence in foreign holdings is continuing to weaken.
There is a trend of de-dollarization, but the structural status of the US dollar remains solid.
From the perspective of the global monetary system, the process of de-dollarization is evident, but the structural status of the dollar has not yet been substantially eroded.
Looking at the core structural indicators of the US dollar in global assets, liabilities, foreign exchange transactions, and cross-border settlements, there has been some contraction since 2024 compared to 2026.
According to the latest COFER data from the IMF, the US dollar will account for 56.9% of global foreign exchange reserves in the third quarter of 2025, slightly higher than the level at the end of 2024 after adjusting for exchange rates. The overall fluctuation in the proportion is mostly driven by exchange rate valuation, rather than by the central bank's active portfolio adjustments.
By mid-2025, the US dollar will account for 86.8% of transactions in the over-the-counter foreign exchange market. After exchange rate adjustments, this figure may rebound compared to 2024, but it will still be weaker than in 2026.
A weaker dollar may be a result of global capital reallocation.
The core of "American exceptionalism" is the relative attractiveness of American assets compared to other parts of the world. Since the second half of last year, the market has begun to price in the first synchronized global recovery after the pandemic, the Russia-Ukraine conflict, and tariff shocks, and expectations for global economic resilience have continued to rise.
Against this backdrop, a rebound in global risk appetite has driven funds to pro-cyclical assets such as emerging markets, with the cumulative inflow of funds into two leading emerging market stock ETFs reaching its fastest growth rate in more than a decade.
Such capital migration is naturally bearish for the US dollar index. In essence, besides the weakening of the dollar's fundamentals, it is also due to the emergence of more cost-effective investment opportunities in overseas markets.
Four key signals: Warning of weakening demand for US Treasury bonds overseas
To predict future market trends, it is crucial to monitor four key indicators to anticipate potential additional pressure on the US dollar index from weakening demand for US Treasury bonds overseas:
Widening swap spreads and concentrated selling of US Treasuries by overseas entities will push up the yield on US Treasuries relative to the SOFR rate.
The yield curve has steepened significantly, especially the 5/10-year and 5/30-year curves, making it easy for long-term yields to decouple from valuations.
The sharp decline in indirect bidding data at US Treasury auctions confirms the pressure on official funds to reduce their holdings.
Two major risk factors: Be wary of a structural sell-off triggered by the US dollar.
Although the current weakening of the US dollar index is driven by cyclical factors, two major risks that could trigger a structural sell-off still need to be noted.
Excluding the extreme scenario of the US implementing capital controls, the biggest risk this year is the independence of the Federal Reserve—if the market interprets this as the Fed being forced to cut interest rates inappropriately, the dollar index may experience a panic sell-off, corresponding to a return of US real interest rates to negative territory.
Another core risk is the US fiscal fundamentals. The persistently high deficit coupled with the massive issuance of US Treasury bonds will erode the core logic of the US dollar as a "safe asset." If this is compounded by a continued decline in foreign participation, the probability of a structural revaluation of the US dollar index will surge significantly.
Overall, the outlook for the US dollar index in 2026 remains bearish. Declining short-term interest rates (expected to be followed by two Fed rate cuts this year) will drive continued dollar hedging. Slower US economic growth in the second half of the year, coupled with improving Eurozone data, will jointly suppress the dollar exchange rate (the euro has a 57.6% weighting in the dollar index, playing a decisive role in its movement).
Ultimately, the weakening of the US dollar index in 2026 is a combined result of global economic cycle divergence, policy pace differences, and capital reallocation; the structural foundation of the dollar system remains unshaken. In this process, it is crucial to distinguish between cyclical fluctuations and structural changes, and to accurately grasp policy shifts and capital flow signals in order to seize investment opportunities amidst the volatility of the US dollar index.
(US Dollar Index Daily Chart, Source: FX678)
At 20:25 Beijing time, the US dollar index is currently at 97.91.
- Risk Warning and Disclaimer
- The market involves risk, and trading may not be suitable for all investors. This article is for reference only and does not constitute personal investment advice, nor does it take into account certain users’ specific investment objectives, financial situation, or other needs. Any investment decisions made based on this information are at your own risk.