The escalating US-Iran standoff has caused massive shocks in the energy market, but why isn't gold "exploding"?
2026-03-03 11:52:27
On Tuesday (March 3) during Asian trading hours, spot gold fluctuated upwards, currently trading around $5,366 per ounce, with a daily increase of approximately 0.85%, as the market digests new geopolitical news from the Middle East. Although a sharp surge in US crude oil prices caused volatility in the energy market, gold's reaction was relatively mild. Technically, the medium-term trend for gold prices leans towards bullishness, and the market signals are clear: gold is supported but has not yet entered a breakout pattern.
Crude oil remains the commodity most directly affected by developments in the Middle East, so it's not surprising that US crude oil surged more than 12% on Monday. However, most of the volatility occurred in the early trading session, and prices have since given back some of those gains. This suggests that the initial jump was primarily a reaction to news of unrest between the US and Iran over the weekend, rather than confirmation of the escalation of the situation during Monday's trading session.
Iran has vowed to effectively blockade the Strait of Hormuz by targeting vessels attempting to cross the waters. While such a blockade is legally untenable under international maritime law, direct attacks, mine-laying activities, drone strikes, or credible threats would escalate insurance costs and security risks to the point where commercial shipping could be forced to a standstill. This distinction—legal authorization versus actual disruption—is crucial for the market.
On Tuesday during Asian trading hours, US crude oil prices fluctuated upwards, currently trading around $72.42 per barrel, with a daily increase of approximately 1.6%. The current price movement reflects the market's awaiting further clear upward signals.
On the 1-hour chart, WTI crude oil is consolidating within a range. A significant upward move may require broader confirmation, while signs of a breakout could cause some of the embedded risk premium to fade. Until then, prices appear likely to trade within a short-term range of approximately $70 to $73.
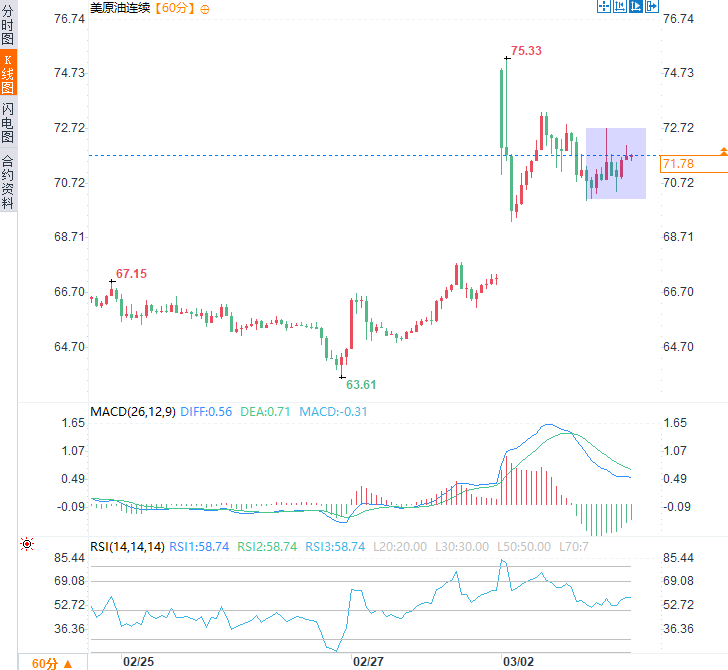
(US crude oil hourly chart, source: FX678)
Gold reacts less strongly to surges in oil prices than to the potential for energy shocks to become sustained events. While short-term oil price increases support safe-haven demand, a prolonged disruption to energy supplies (especially from the Strait of Hormuz) could trigger deeper inflationary and growth shocks. In such an environment, gold often transforms from a defensive hedge into a trend-following trading instrument.
Currently, the precious metals market appears to be in a state of support rather than frenzy – reflecting that the market has recognized the increased risks, but has not yet incorporated systemic upgrades into pricing.
The daily chart for spot gold shows that prices are in a strong uptrend, trading above the 10-day and 20-day exponential moving averages (around 5200 and 5100 respectively). Following the surge and pullback in February, prices have recently been consolidating near these highs.
Gold continues its clear uptrend, trading easily above the 10-day and 20-day EMAs (around 5200 and 5100 respectively). The overall structure remains bullish, but momentum is no longer accelerating—instead, it's consolidating.
Monday's rise briefly broke through 5400 before falling back to form a spinning top doji, further confirming that while buying pressure exists, it is not aggressive. With the RSI (14) indicator firmly above the 50 midline and gradually approaching the overbought zone, and the two-way influence of oil price fluctuations, the path of least resistance for gold prices in the short term is likely to be a volatile strengthening or sideways movement, rather than an immediate breakout.
Price action suggests a potential for lower highs below 5400, and unless a new safe-haven catalyst emerges, any rebound to that area could continue to trigger profit-taking. Initial support is around $5270, while $5200—close to the 10-day EMA—is a more significant level where short coverrs may re-enter.
In short, the trend remains bullish, but gold appears to be supported rather than in a breakout pattern, and a clear catalyst is needed to push it above $5,400.
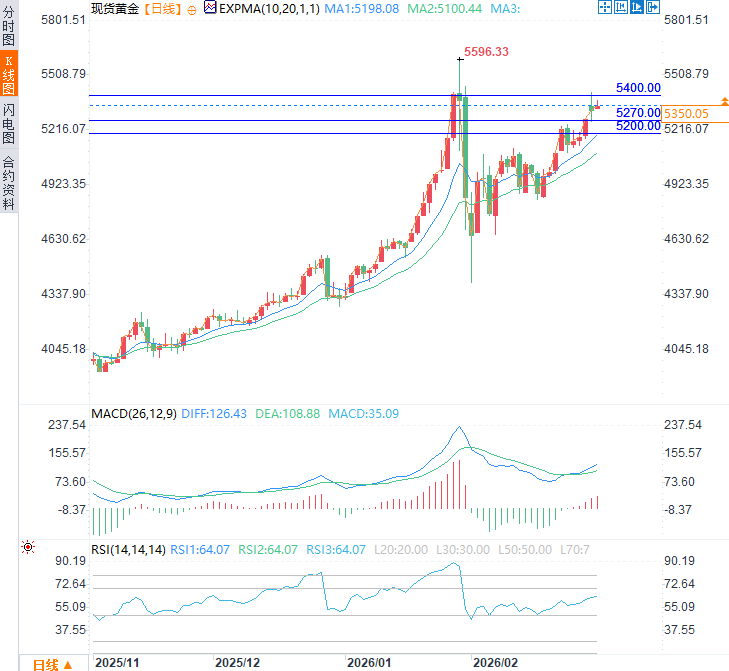
(Spot gold daily chart, source: FX678)
At 11:50 Beijing time, spot gold was trading at $5362.60 per ounce.
Oil prices found support, awaiting a catalyst for a breakout.
Crude oil remains the commodity most directly affected by developments in the Middle East, so it's not surprising that US crude oil surged more than 12% on Monday. However, most of the volatility occurred in the early trading session, and prices have since given back some of those gains. This suggests that the initial jump was primarily a reaction to news of unrest between the US and Iran over the weekend, rather than confirmation of the escalation of the situation during Monday's trading session.
Iran has vowed to effectively blockade the Strait of Hormuz by targeting vessels attempting to cross the waters. While such a blockade is legally untenable under international maritime law, direct attacks, mine-laying activities, drone strikes, or credible threats would escalate insurance costs and security risks to the point where commercial shipping could be forced to a standstill. This distinction—legal authorization versus actual disruption—is crucial for the market.
On Tuesday during Asian trading hours, US crude oil prices fluctuated upwards, currently trading around $72.42 per barrel, with a daily increase of approximately 1.6%. The current price movement reflects the market's awaiting further clear upward signals.
On the 1-hour chart, WTI crude oil is consolidating within a range. A significant upward move may require broader confirmation, while signs of a breakout could cause some of the embedded risk premium to fade. Until then, prices appear likely to trade within a short-term range of approximately $70 to $73.
(US crude oil hourly chart, source: FX678)
Gold is supported by energy risks and awaits a catalyst for escalating tensions.
Gold reacts less strongly to surges in oil prices than to the potential for energy shocks to become sustained events. While short-term oil price increases support safe-haven demand, a prolonged disruption to energy supplies (especially from the Strait of Hormuz) could trigger deeper inflationary and growth shocks. In such an environment, gold often transforms from a defensive hedge into a trend-following trading instrument.
Currently, the precious metals market appears to be in a state of support rather than frenzy – reflecting that the market has recognized the increased risks, but has not yet incorporated systemic upgrades into pricing.
The daily chart for spot gold shows that prices are in a strong uptrend, trading above the 10-day and 20-day exponential moving averages (around 5200 and 5100 respectively). Following the surge and pullback in February, prices have recently been consolidating near these highs.
Gold Technical Analysis
Gold continues its clear uptrend, trading easily above the 10-day and 20-day EMAs (around 5200 and 5100 respectively). The overall structure remains bullish, but momentum is no longer accelerating—instead, it's consolidating.
Monday's rise briefly broke through 5400 before falling back to form a spinning top doji, further confirming that while buying pressure exists, it is not aggressive. With the RSI (14) indicator firmly above the 50 midline and gradually approaching the overbought zone, and the two-way influence of oil price fluctuations, the path of least resistance for gold prices in the short term is likely to be a volatile strengthening or sideways movement, rather than an immediate breakout.
Price action suggests a potential for lower highs below 5400, and unless a new safe-haven catalyst emerges, any rebound to that area could continue to trigger profit-taking. Initial support is around $5270, while $5200—close to the 10-day EMA—is a more significant level where short coverrs may re-enter.
In short, the trend remains bullish, but gold appears to be supported rather than in a breakout pattern, and a clear catalyst is needed to push it above $5,400.
(Spot gold daily chart, source: FX678)
At 11:50 Beijing time, spot gold was trading at $5362.60 per ounce.
- Risk Warning and Disclaimer
- The market involves risk, and trading may not be suitable for all investors. This article is for reference only and does not constitute personal investment advice, nor does it take into account certain users’ specific investment objectives, financial situation, or other needs. Any investment decisions made based on this information are at your own risk.