Brent crude oil nears $90, surging 22% this week! The Strait of Hormuz blockade tests the global economy.
2026-03-06 21:17:02
On Friday, March 6, escalating geopolitical conflicts in the Middle East disrupted shipping lanes in the Strait of Hormuz, directly pushing up international oil prices. Brent crude prices climbed to near a two-year high, with market supply concerns dominating trading. The benchmark oil price rose by more than 3% that day, and its cumulative weekly gain approached 23%, marking the largest weekly increase since the spring of 2020.

Meanwhile, global stock markets came under pressure, with US stock futures and major European stock indices falling in tandem, and bond yields rising for the fifth consecutive day. Interest rate market expectations regarding central bank policy paths tightened rapidly. This backdrop highlights how energy price volatility is directly reshaping the logic of global asset pricing through inflation expectations and supply chain transmission mechanisms.
The Middle East has extremely limited oil storage facilities and alternative pipeline capacity. Once storage tanks are full or detour routes reach their limits, crude oil production in the region will be forced to reduce. This structural bottleneck has already manifested in places like Iraq, forcing local production to be proactively reduced. The Strait of Hormuz, a global oil transportation chokepoint, handles approximately 20.9 million barrels of supply per day, accounting for one-fifth of the world's total. Its continued obstruction directly amplifies the risk of a lack of supply elasticity. Analysts from multiple institutions point out that every additional day the strait remains closed, upward pressure on oil prices accumulates, and the market's pricing of a long-term disruption has shifted from short-term shocks to a structural reassessment.
Qatar's energy minister recently stated that if the conflict prolongs, all Gulf energy producers may halt exports within weeks, pushing oil prices to $150 per barrel and causing widespread damage to the global economy. Data shows that Brent crude oil prices have rebounded rapidly from their early-month lows, currently trading at $89.22 per barrel, with an intraday high of $89.47; WTI crude oil has seen an even larger increase during the same period. Both have reached their highest levels since 2024, recording astonishing gains of 22% and 27% respectively this week, far exceeding their usual trading range. The transmission speed of this supply-side shock is far faster than adjustments caused by changes in demand; traders need to closely monitor strait navigation data as a leading indicator.
Compared to a similar event in 2022, while the current price increase is nearing its peak, the absolute level is still only about $3.40 higher than the four-year average, indicating that the market has not yet fully priced in the most extreme scenario. However, the reality of dwindling storage capacity is gradually pushing this premium higher, and traders need to be wary of the amplifying effect of weekend geopolitical news on Monday's opening.
The rapid rise in oil prices has directly boosted inflation expectations, leading to a sharp adjustment in interest rate pricing. Money market traders have drastically reduced their expectations for a Federal Reserve rate cut this year from about 55 basis points a week ago to 30-35 basis points. The yield on the 10-year US Treasury note rose to 4.17%, a cumulative increase of 21 basis points this week, the largest weekly gain in the past year. Europe, with its higher import dependence, has been particularly affected: the European Central Bank's previous bets on rate cuts have been completely wiped out, with the possibility of a rate hike at the end of the year now emerging; the Bank of England's expectation for the number of rate cuts this year has been reduced from two to about one, and volatility in the UK bond market has increased accordingly.
In the stock market, the European STOXX 600 index fell 1.04% intraday, US S&P 500 futures fell 0.62%, Nasdaq futures fell 0.75%, and the weekly decline in Asia-Pacific indices widened to 6.6%. The US dollar index rose 1.8% this week, marking its largest weekly gain since September 2024, reflecting a concentrated inflow of safe-haven funds into dollar assets. While gold prices remained relatively stable, they fell about 3% for the week, indicating that market concerns about stagflation triggered by high oil prices have overshadowed traditional safe-haven logic. A $10 increase per barrel in oil prices can push up global inflation by approximately 0.2 to 0.4 percentage points. This transmission path is directly eroding corporate profit margins through energy costs, particularly putting pressure on European manufacturing and transportation sectors.
Commodity analysts emphasize that the rigid constraints on Middle Eastern storage and bypass capacity mean that supply contraction will exceed initial market expectations. UBS commodity analysts point out that the longer the Straits remain closed, the clearer the upside risk to prices becomes; the Commerzbank team similarly warns that once storage units are saturated, regional production will be passively reduced, a process that has already begun. The Qatari Energy Minister's $150 warning further reinforces extreme scenario pricing, reminding traders to pay attention to the impact of potential diplomatic developments over the weekend on next week's opening.
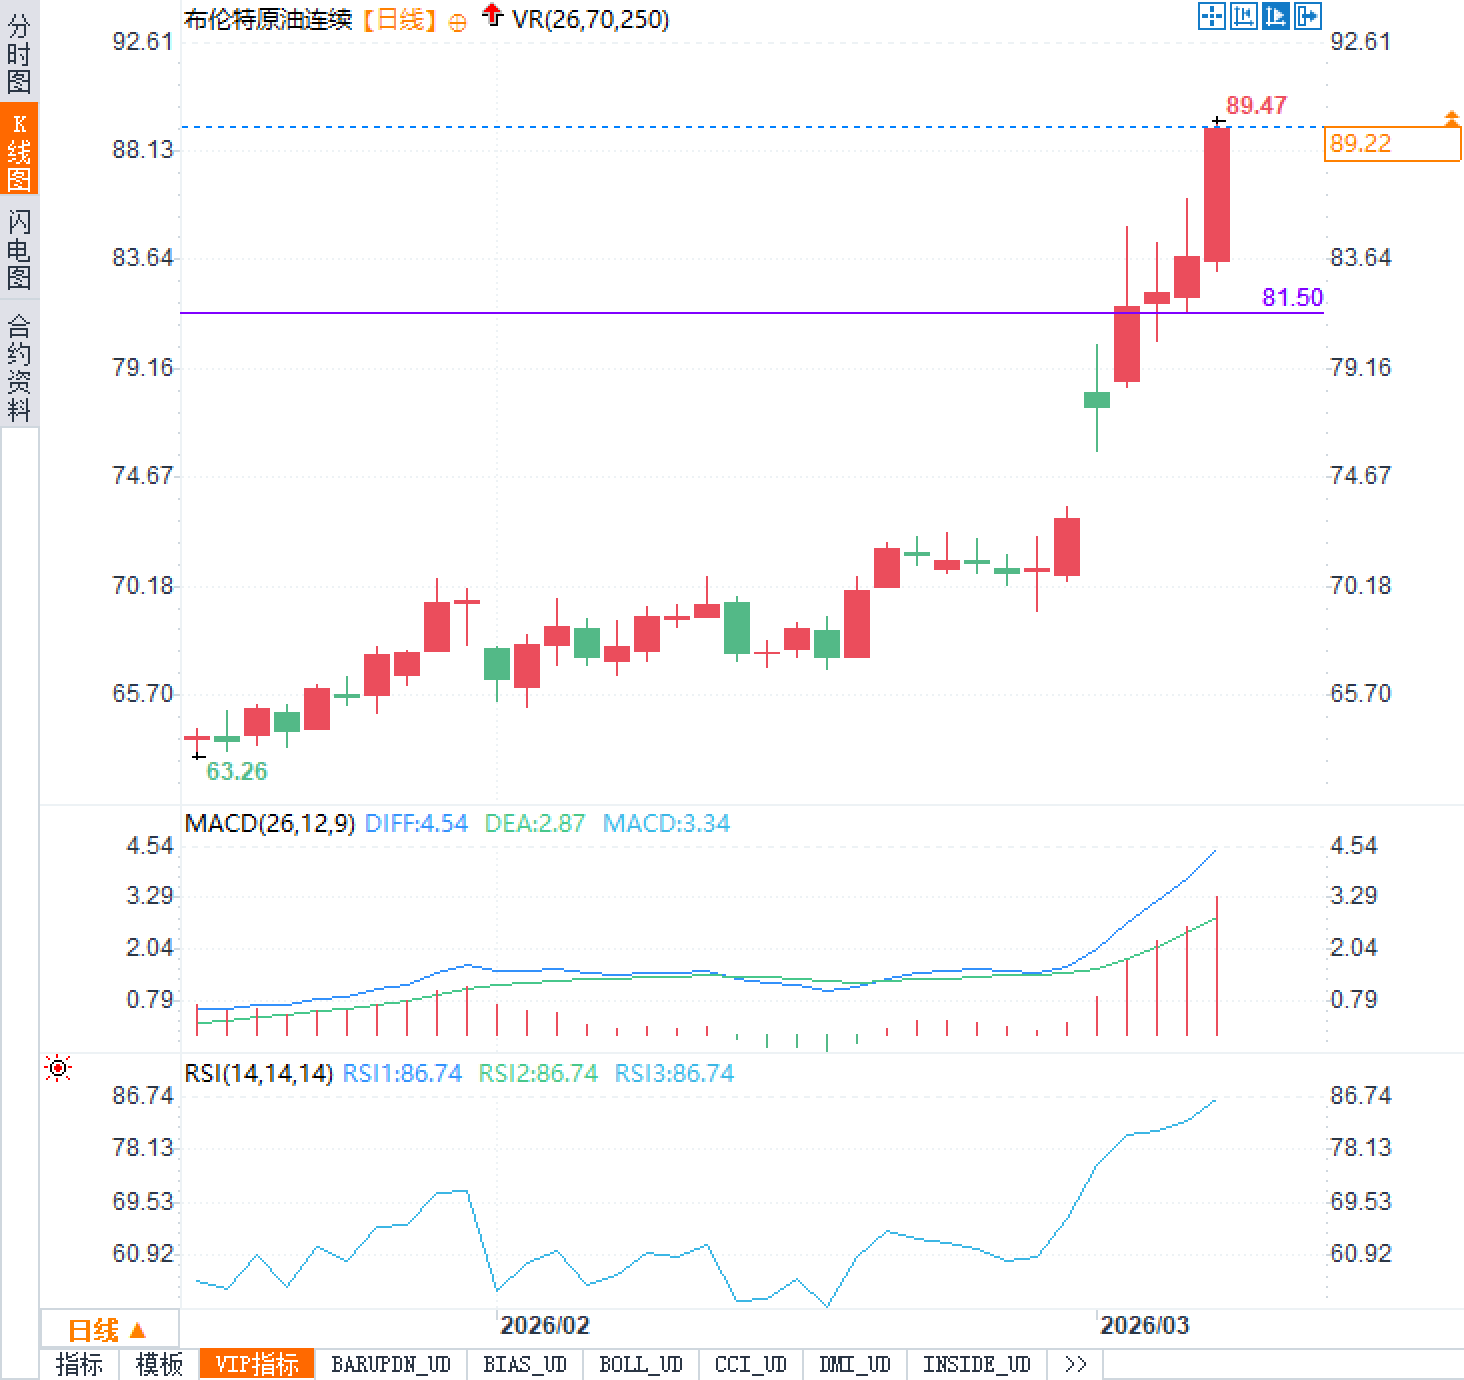
Technically, the Brent crude oil daily chart shows that the price has broken through $81.50 and is currently stabilizing around $89. The MACD indicator shows a DIFF value of 4.54, a DEA value of 2.87, and a MACD histogram of 3.34, indicating that the bullish momentum continues to strengthen; the RSI (14) reading reached 86.74, entering the overbought zone, suggesting that the risk of a short-term pullback has increased, but the trend is still relatively strong. Historically, the current weekly increase has approached the peak of the recovery period after the 2020 pandemic, but the absolute price is still above the average range of the past four years, indicating that the current increase is more due to supply shocks than demand recovery. In the long term, if the strait navigation resumes, oil prices may face pressure to fall rapidly; conversely, continued disruptions will push up global energy costs, forcing central banks to make a more difficult trade-off between growth and inflation. Traders need to continuously monitor macroeconomic indicators such as non-farm payroll data to determine whether the oil price shock has been transmitted to the real economy.
Meanwhile, global stock markets came under pressure, with US stock futures and major European stock indices falling in tandem, and bond yields rising for the fifth consecutive day. Interest rate market expectations regarding central bank policy paths tightened rapidly. This backdrop highlights how energy price volatility is directly reshaping the logic of global asset pricing through inflation expectations and supply chain transmission mechanisms.
Middle East supply risks dominate oil market dynamics
The Middle East has extremely limited oil storage facilities and alternative pipeline capacity. Once storage tanks are full or detour routes reach their limits, crude oil production in the region will be forced to reduce. This structural bottleneck has already manifested in places like Iraq, forcing local production to be proactively reduced. The Strait of Hormuz, a global oil transportation chokepoint, handles approximately 20.9 million barrels of supply per day, accounting for one-fifth of the world's total. Its continued obstruction directly amplifies the risk of a lack of supply elasticity. Analysts from multiple institutions point out that every additional day the strait remains closed, upward pressure on oil prices accumulates, and the market's pricing of a long-term disruption has shifted from short-term shocks to a structural reassessment.
Qatar's energy minister recently stated that if the conflict prolongs, all Gulf energy producers may halt exports within weeks, pushing oil prices to $150 per barrel and causing widespread damage to the global economy. Data shows that Brent crude oil prices have rebounded rapidly from their early-month lows, currently trading at $89.22 per barrel, with an intraday high of $89.47; WTI crude oil has seen an even larger increase during the same period. Both have reached their highest levels since 2024, recording astonishing gains of 22% and 27% respectively this week, far exceeding their usual trading range. The transmission speed of this supply-side shock is far faster than adjustments caused by changes in demand; traders need to closely monitor strait navigation data as a leading indicator.
| Crude oil varieties | Latest price (USD/barrel) | Today's increase | Weekly gains |
|---|---|---|---|
| Brent crude oil | 89.22 | +3.5% | +22% |
| WTI crude oil | 86.00 | +4.8% | +27% |
Asset price revaluation under the impact of oil prices
The rapid rise in oil prices has directly boosted inflation expectations, leading to a sharp adjustment in interest rate pricing. Money market traders have drastically reduced their expectations for a Federal Reserve rate cut this year from about 55 basis points a week ago to 30-35 basis points. The yield on the 10-year US Treasury note rose to 4.17%, a cumulative increase of 21 basis points this week, the largest weekly gain in the past year. Europe, with its higher import dependence, has been particularly affected: the European Central Bank's previous bets on rate cuts have been completely wiped out, with the possibility of a rate hike at the end of the year now emerging; the Bank of England's expectation for the number of rate cuts this year has been reduced from two to about one, and volatility in the UK bond market has increased accordingly.
In the stock market, the European STOXX 600 index fell 1.04% intraday, US S&P 500 futures fell 0.62%, Nasdaq futures fell 0.75%, and the weekly decline in Asia-Pacific indices widened to 6.6%. The US dollar index rose 1.8% this week, marking its largest weekly gain since September 2024, reflecting a concentrated inflow of safe-haven funds into dollar assets. While gold prices remained relatively stable, they fell about 3% for the week, indicating that market concerns about stagflation triggered by high oil prices have overshadowed traditional safe-haven logic. A $10 increase per barrel in oil prices can push up global inflation by approximately 0.2 to 0.4 percentage points. This transmission path is directly eroding corporate profit margins through energy costs, particularly putting pressure on European manufacturing and transportation sectors.
Market Participant Perspectives and Long-Term Outlook
Commodity analysts emphasize that the rigid constraints on Middle Eastern storage and bypass capacity mean that supply contraction will exceed initial market expectations. UBS commodity analysts point out that the longer the Straits remain closed, the clearer the upside risk to prices becomes; the Commerzbank team similarly warns that once storage units are saturated, regional production will be passively reduced, a process that has already begun. The Qatari Energy Minister's $150 warning further reinforces extreme scenario pricing, reminding traders to pay attention to the impact of potential diplomatic developments over the weekend on next week's opening.
Technically, the Brent crude oil daily chart shows that the price has broken through $81.50 and is currently stabilizing around $89. The MACD indicator shows a DIFF value of 4.54, a DEA value of 2.87, and a MACD histogram of 3.34, indicating that the bullish momentum continues to strengthen; the RSI (14) reading reached 86.74, entering the overbought zone, suggesting that the risk of a short-term pullback has increased, but the trend is still relatively strong. Historically, the current weekly increase has approached the peak of the recovery period after the 2020 pandemic, but the absolute price is still above the average range of the past four years, indicating that the current increase is more due to supply shocks than demand recovery. In the long term, if the strait navigation resumes, oil prices may face pressure to fall rapidly; conversely, continued disruptions will push up global energy costs, forcing central banks to make a more difficult trade-off between growth and inflation. Traders need to continuously monitor macroeconomic indicators such as non-farm payroll data to determine whether the oil price shock has been transmitted to the real economy.
Frequently Asked Questions
Question 1: How do Middle East conflicts amplify oil price volatility through supply bottlenecks?
A: Middle Eastern storage facilities and alternative pipelines have rigid capacity; once fully loaded, production is forced to shrink. The Strait of Hormuz accounts for 20% of global supply; its blockage directly cuts off logistics, and Iraq has already seen actual production cuts. The Qatari minister warned of a possible complete halt to exports within weeks, pushing prices towards the extreme scenario of $150 per barrel. This mechanism is far stronger than demand-side fluctuations, leading to a 22% surge in Brent crude this week.
Question 2: Why did the rise in oil prices quickly change the central bank's expectations for interest rate cuts?
A: Rising oil prices per barrel directly push up inflation expectations, leading the Federal Reserve to narrow its rate-cutting path this year from 55 basis points to 30-35 basis points, and the US Treasury yield rose 21 basis points to 4.17% this week; the probability of the European Central Bank raising interest rates has increased, and the expected number of rate cuts by the Bank of England has halved. Energy costs are being passed on to the CPI and PPI, forcing monetary policy to tighten, which puts pressure on the stock market.
Question 3: What signals do technical indicators show, and what risks should traders be aware of?
A: The Brent crude oil daily MACD is in a bullish alignment, and the RSI has reached an overbought level of 86.74. The price has stabilized above $89, indicating a strong trend, but the overbought zone suggests a possible short-term pullback. Traders should be wary of the amplified effects of weekend geopolitical news, confirmation of production cuts after storage saturation, and the negative feedback loop between oil prices and interest rate expectations.
- Risk Warning and Disclaimer
- The market involves risk, and trading may not be suitable for all investors. This article is for reference only and does not constitute personal investment advice, nor does it take into account certain users’ specific investment objectives, financial situation, or other needs. Any investment decisions made based on this information are at your own risk.