With oil prices plummeting, has the dollar bulls also lost their momentum?
2026-03-10 20:32:47
On Tuesday, March 10th, the US dollar index traded around 98.70 during the European session, experiencing slight intraday pressure and falling nearly 1% from its recent high of 99.6950. This change stemmed directly from the rapid fading of war risk premiums in the oil market. WTI crude oil prices plummeted to $88.20 per barrel, a single-day drop of 6.70%, while Brent crude oil also fell to around $91.30 per barrel. The market quickly adjusted its pricing in geopolitical tensions, with global stock and bond markets rebounding in tandem, while the safe-haven appeal of the US dollar temporarily weakened.
Analysts point out that, setting aside geopolitical factors, the US dollar is poised to retest the lower end of its trading range since June 2025 due to narrowing interest rate differentials with other major economies. The energy market remains highly headline-driven, and shipping safety in the Strait of Hormuz remains a key barometer of global energy risk.
The sharp fluctuations in crude oil prices have become the core driver of the short-term trend of the US dollar index. WTI crude oil prices have fallen rapidly by more than 25% from a high of nearly $120 per barrel at the beginning of the week, with a single-day drop of more than 7%. This change stems from the market's repricing of a possible rapid easing of the situation in the Middle East, directly weakening the safe-haven support for the US dollar. Analysts emphasize that the energy market remains extremely sensitive to headlines, and the safety of shipping in the Strait of Hormuz is a major benchmark for measuring global energy risks. With the risk premium compressed significantly, the US dollar has generally weakened against major currencies such as the euro, yen, and pound sterling. Traders need to closely monitor the correlation coefficient between crude oil prices and the US dollar index, which has recently fallen rapidly from 0.65 to below 0.35.
Under this transmission mechanism, safe-haven buying of the US dollar index quickly subsided, coupled with the recovery of global risk assets, forming a clear negative feedback loop.
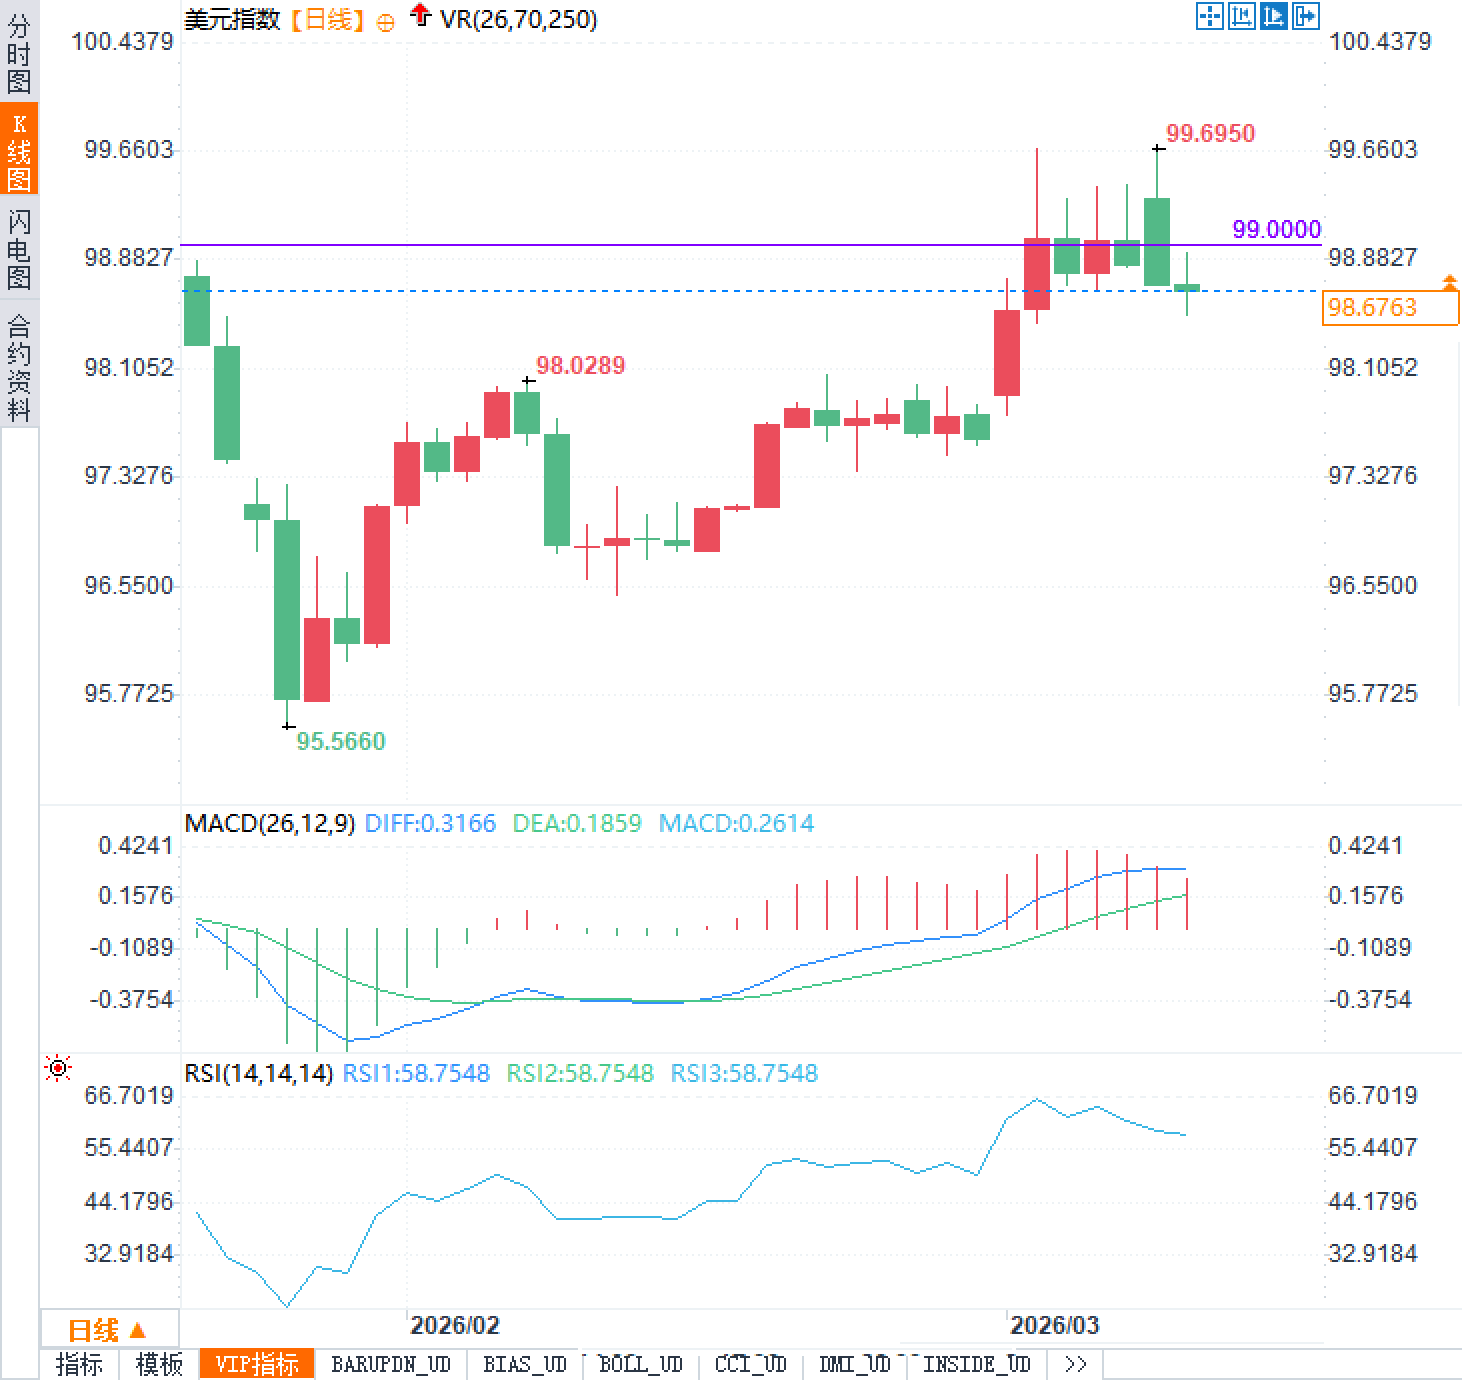
The daily chart shows that the US dollar index has fallen from a high of 99.6950 and is testing the psychological level of 98.0000. The MACD indicator shows a DIFF value of 0.3166, a DEA value of 0.1859, and a MACD histogram of 0.2614, still maintaining a golden cross but with narrowing bars, indicating that upward momentum is gradually weakening. The RSI (14) reading is 58.7, in a neutral-to-bullish range and not yet in overbought territory. If 98.50 is effectively breached, it will open up downside potential, targeting the lower edge of the range near 98; conversely, if it holds above 99, a rebound may resume.
Besides the oil price factor, the main structural pressure facing the US dollar index comes from the gradual narrowing of interest rate differentials among major economies. The Federal Reserve's federal funds rate remains in the 3.50%-3.75% range, the European Central Bank's deposit rate is 2.15%, the Bank of England's benchmark interest rate is 3.75%, and the Bank of Japan's policy rate is 0.75%. Although the Fed's interest rate remains relatively high, adjustments in market expectations regarding the policy paths of other central banks have led to a marginal narrowing of real interest rate differentials, reducing the dollar's attractiveness. Analysts point out that the narrowing interest rate differentials are pushing the dollar to retest the lower end of its range since June 2025. This structural change, coupled with the fading risk premium from oil, creates a double pressure.
The interconnectedness of global assets has further reinforced this pattern, with the decline in bond yields and the rebound in stock markets simultaneously weakening the relative advantage of the US dollar.
Analysts point out that, setting aside geopolitical factors, the US dollar is poised to retest the lower end of its trading range since June 2025 due to narrowing interest rate differentials with other major economies. The energy market remains highly headline-driven, and shipping safety in the Strait of Hormuz remains a key barometer of global energy risk.
Market transmission mechanism for the decline of crude oil risk premium
The sharp fluctuations in crude oil prices have become the core driver of the short-term trend of the US dollar index. WTI crude oil prices have fallen rapidly by more than 25% from a high of nearly $120 per barrel at the beginning of the week, with a single-day drop of more than 7%. This change stems from the market's repricing of a possible rapid easing of the situation in the Middle East, directly weakening the safe-haven support for the US dollar. Analysts emphasize that the energy market remains extremely sensitive to headlines, and the safety of shipping in the Strait of Hormuz is a major benchmark for measuring global energy risks. With the risk premium compressed significantly, the US dollar has generally weakened against major currencies such as the euro, yen, and pound sterling. Traders need to closely monitor the correlation coefficient between crude oil prices and the US dollar index, which has recently fallen rapidly from 0.65 to below 0.35.
| Crude oil varieties | Latest price (USD/barrel) | Daily fluctuation range | Falling from this week's high |
|---|---|---|---|
| WTI crude oil | 88.20 | -6.70% | Approximately 25% |
| Brent crude oil | 91.30 | -7.75% | Approximately 23% |
Key Technical Levels and Indicator Signals for the US Dollar Index
The daily chart shows that the US dollar index has fallen from a high of 99.6950 and is testing the psychological level of 98.0000. The MACD indicator shows a DIFF value of 0.3166, a DEA value of 0.1859, and a MACD histogram of 0.2614, still maintaining a golden cross but with narrowing bars, indicating that upward momentum is gradually weakening. The RSI (14) reading is 58.7, in a neutral-to-bullish range and not yet in overbought territory. If 98.50 is effectively breached, it will open up downside potential, targeting the lower edge of the range near 98; conversely, if it holds above 99, a rebound may resume.
Medium- to long-term pressure on the US dollar due to narrowing interest rate spreads
Besides the oil price factor, the main structural pressure facing the US dollar index comes from the gradual narrowing of interest rate differentials among major economies. The Federal Reserve's federal funds rate remains in the 3.50%-3.75% range, the European Central Bank's deposit rate is 2.15%, the Bank of England's benchmark interest rate is 3.75%, and the Bank of Japan's policy rate is 0.75%. Although the Fed's interest rate remains relatively high, adjustments in market expectations regarding the policy paths of other central banks have led to a marginal narrowing of real interest rate differentials, reducing the dollar's attractiveness. Analysts point out that the narrowing interest rate differentials are pushing the dollar to retest the lower end of its range since June 2025. This structural change, coupled with the fading risk premium from oil, creates a double pressure.
| Central Bank | Latest policy interest rates | Expected adjustment range for 2026 |
|---|---|---|
| Fed | 3.50%-3.75% | Limited easing expectations |
| European Central Bank | 2.15% | Maintain stability throughout the year |
| Bank of England | 3.75% | Potential slight tightening |
| Bank of Japan | 0.75% | Gradual normalization |
Frequently Asked Questions
Question 1: How does the decline in crude oil risk premium directly affect the trend of the US dollar index?
A: The fading risk premium in crude oil prices weakened the safe-haven demand for the US dollar, as the dollar typically strengthens during periods of geopolitical tension due to safe-haven inflows. Following the recent nearly 7% drop in oil prices, the market quickly removed the war premium, putting downward pressure on the dollar against major currencies and simultaneously pushing up risk asset prices, creating a negative correlation. Traders observed a significant short-term decline in the correlation between oil prices and the US dollar index, a mechanism that explains the core driver of the current pullback.
Question 2: Why has the narrowing interest rate spread become the main reason for the medium- to long-term pressure on the US dollar?
A: The divergence in monetary policies among major economies has led to a narrowing of real interest rate differentials. Although the Federal Reserve's interest rates remain high, adjustments to expectations by other central banks, such as the European Central Bank and the Bank of Japan, have compressed the dollar's yield advantage. Analysis shows that this structural factor is pushing the dollar to test the lower end of its trading range. Traders need to pay attention to the comparison between the Fed's dot plot and those of overseas central banks, as the dynamics of interest rate differentials directly determine the central axis of the dollar's trading range.
- Risk Warning and Disclaimer
- The market involves risk, and trading may not be suitable for all investors. This article is for reference only and does not constitute personal investment advice, nor does it take into account certain users’ specific investment objectives, financial situation, or other needs. Any investment decisions made based on this information are at your own risk.