Don't just focus on safe havens! The "bearish steepening" of US Treasury yields is reshaping the dollar's logic, and gold should be wary of a "market correction trap" after the $5,000 mark.
2026-03-17 20:12:46
On Tuesday (March 17), global financial markets were caught in the crossfire of heightened geopolitical tensions and the upcoming Federal Reserve interest rate meeting. Oil prices fluctuated wildly due to the escalating situation in the Middle East, with WTI crude briefly breaking through the $98 mark. Although the upward momentum subsequently slowed, its transmission effect on inflation expectations was quickly reflected in the US Treasury market. Currently, the benchmark 10-year US Treasury yield is fluctuating above 4.21%, reflecting the intense struggle between safe-haven demand and concerns about rising inflation.

The US dollar index retreated slightly to around 99.77 after reaching a high of 100.11, with safe-haven buying driven by geopolitical risks and high-level fluctuations in US Treasury yields providing strong support. Meanwhile, spot gold fluctuated around the $5,000 mark. Although the Middle East situation provided a solid safe-haven premium, hawkish expectations that the Federal Reserve might delay rate cuts limited further upside potential for gold prices. Overall, the market is closely watching the navigation situation in the Strait of Hormuz and the upcoming FOMC meeting, with liquidity remaining cautious amid volatility.
Analysis of the latest market data reveals that the recent strength of the US dollar index is primarily driven by the structural rise in US Treasury yields. Meanwhile, oil prices have repeatedly hit new highs in the past few trading days due to the risk of energy supply disruptions caused by geopolitical tensions. Technically, if oil prices do not break below previous lows and the 8-day moving average support level, their support for inflation expectations will continue.
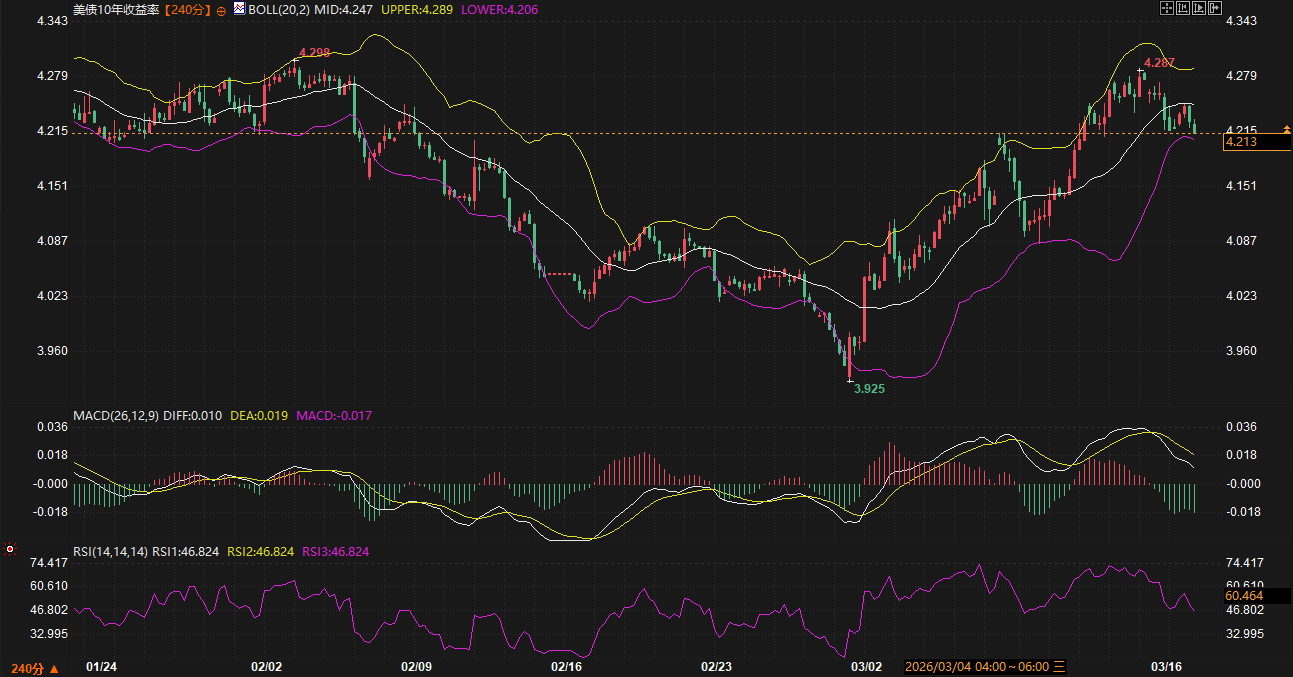
This "inflation transmission" directly led to a steepening of the bear market in the US Treasury market. The 10-year US Treasury yield has fluctuated upwards from 3.925% to the current 4.2% range, and this increase in the yield premium has enhanced the interest rate advantage of the US dollar.
Fundamental Pressures: Federal Reserve watchers and analysts from well-known institutions point out that even before the escalation of the Middle East conflict, the US core PCE price index had already accelerated to 3.1%, far exceeding the target. The impact of the geopolitical situation may reinforce the Federal Reserve's "Higher for longer" policy stance.
Interest Rate Spread Momentum: The Reserve Bank of Australia (RBA) unexpectedly raised interest rates by 25 basis points today, citing a substantial rebound in inflation in the second half of 2025. This leading indicator has raised concerns in the market about whether the Federal Reserve will follow suit and withdraw its previous guidance on rate cuts.
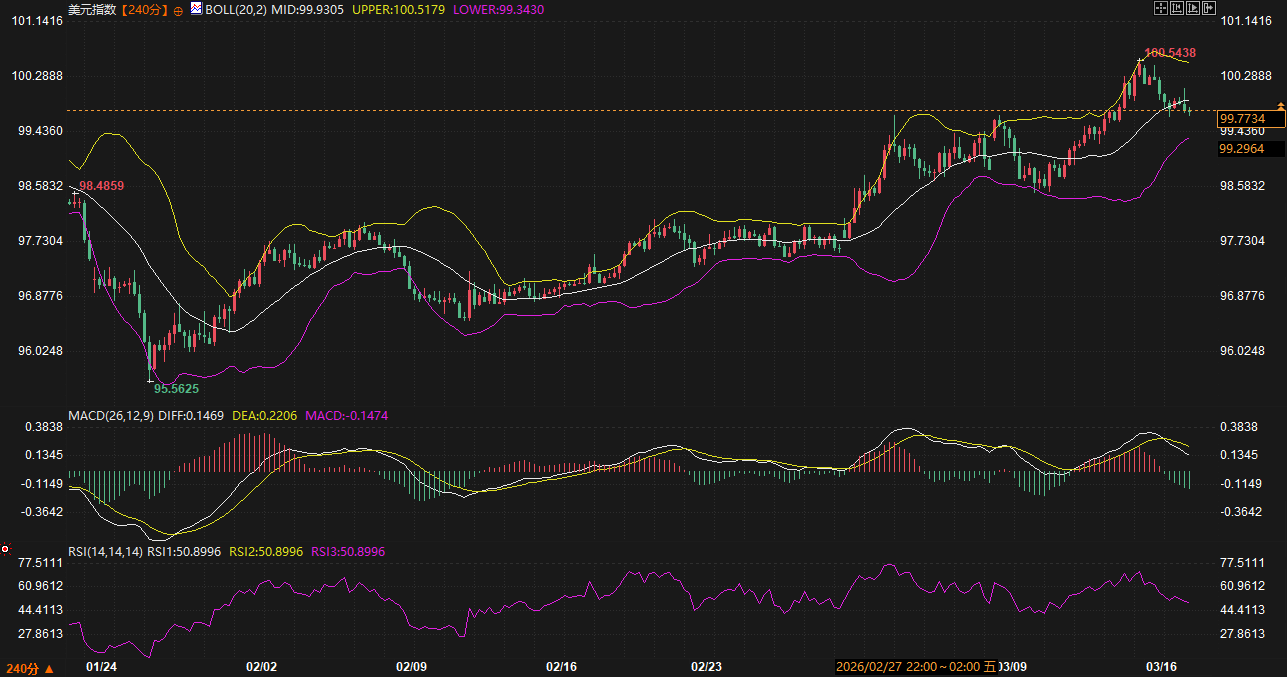
US Dollar Movement: The 240-minute chart of the US Dollar Index shows that the price has broken through the upper Bollinger Band, and the MACD histogram continues to expand. Although it has retreated to around 99.77 in the short term due to profit-taking, as long as the 10-year US Treasury yield holds above the key support range of 4.05%-4.10%, the downside potential for the dollar will be very limited. Currently, the US Dollar Index is showing strong bullish momentum near the 100 level, and the market is digesting the valuation correction brought about by the stabilization of US Treasury yields at high levels.
Spot gold is currently exhibiting an extremely rare "high-level sideways" pattern. Data shows that the spot gold price (XAU) is currently at $5006.45, fluctuating narrowly around the $5000 mark multiple times during the session. Gold's price movement is caught in a struggle between two opposing forces: on one hand, the safe-haven demand stemming from geopolitical conflicts; and on the other hand, the squeeze on asymmetric assets caused by rising real interest rates following energy price inflation expectations.
Fundamental Analysis: The Middle East geopolitical situation has entered its third week, with navigation disrupted in the Strait of Hormuz and new energy facilities impacted, directly locking in gold's "geopolitical floor." However, prominent economic advisors and research institutions believe this impact may be short-lived. If the situation is brought under control within weeks, the safe-haven premium for gold faces the risk of a rapid decline.
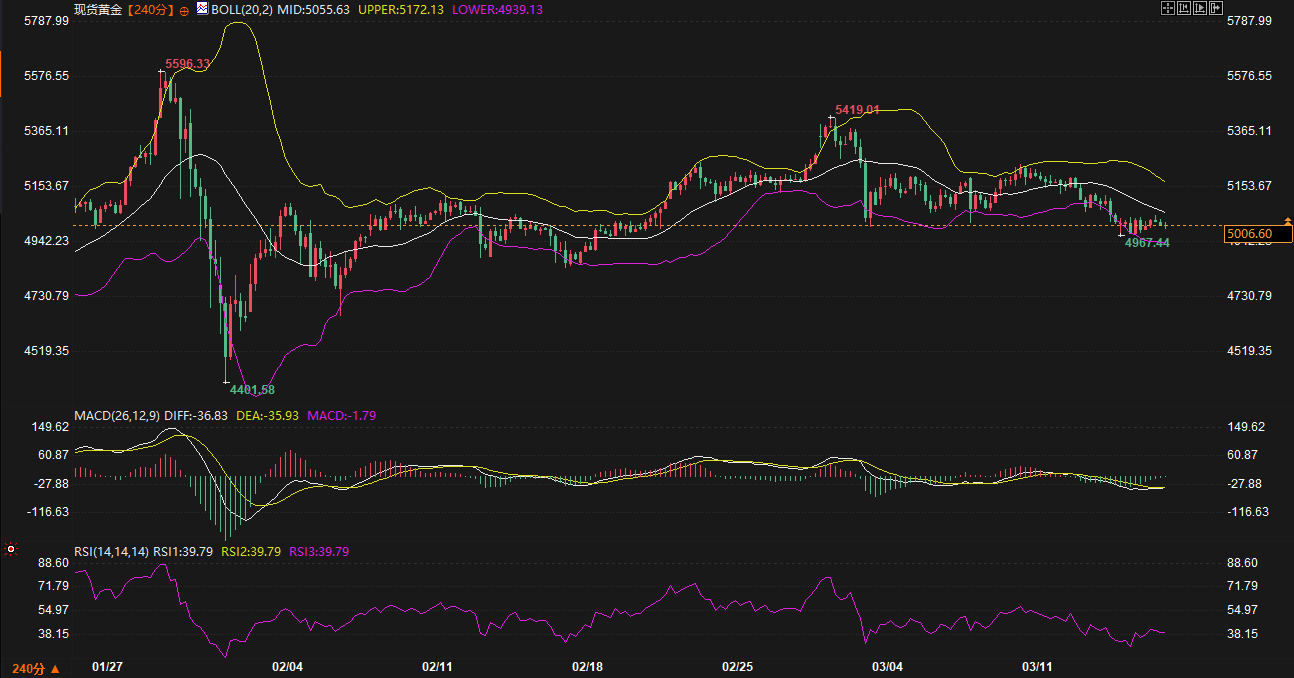
Technical Analysis: The 240-minute candlestick chart shows that gold prices have recently been fluctuating within a broad range of 4900–5600. Currently, the price is approaching the Bollinger Band middle line at 5055.62, which is considered a neutral to slightly bearish zone. The MACD indicator shows the DIFF and DEA lines in a bearish alignment, and the RSI's three lines are averaging around 39.78, suggesting insufficient bullish momentum in the short term.
Key Range: The strength of support at the $5,000 level is crucial for gold prices. If geopolitical tensions do not ease substantially, gold is likely to consolidate above this level; however, if the upcoming FOMC meeting releases an unexpectedly hawkish signal, causing US Treasury yields to rise further, a retest of the lower Bollinger Band support is possible.
Looking ahead to the next 48 to 72 hours, the market will enter a period of extreme sensitivity. With the Federal Reserve entering its interest rate meeting window, the market lacks official guidance, and marginal changes in the geopolitical situation and economic data will become the main drivers of pricing.
From the perspective of US Treasury bonds, the 10-year Treasury yield is likely to fluctuate within a wide range of 4.05% to 4.30% in the short term. If the February pending home sales index remains weak, it may somewhat restrain the rise in yields, thereby slowing the rise of the US dollar. However, the core focus remains on oil prices—if crude oil fails to break below the key support level of $92.93 and end its consecutive gains, concerns about double-dip inflation will continue to push up bond yields, thereby driving the US dollar index to challenge above 101.
For gold, its price movement over the next 2-3 days will depend on the balance between "safe-haven confidence" and "interest rate concerns." Barring further deteriorating geopolitical news, gold prices are likely to consolidate around the $5000 level. Investors should closely monitor the recovery of the Bollinger Band middle line at $5055. Overall, the market is in a period of strong volatility followed by a directional decision-making phase, and the resilience of the US dollar and gold's safe-haven appeal will maintain a strong connection amidst high volatility.
1. Why do the US dollar and gold both show strength when the geopolitical situation in the Middle East escalates?
This phenomenon is often referred to as "safe-haven resonance." During periods of geopolitical instability (such as the current situation in Iran), gold, as a traditional safe-haven asset, attracts inflows of safe-haven funds, driving up its price. Similarly, the US dollar, as the world's core reserve currency and the most liquid asset, also possesses safe-haven attributes during geopolitical crises. The unique aspect of this instance is that rising energy prices directly boosted US Treasury yields, providing the dollar with double support from an interest rate differential perspective (safe-haven demand + expectations of interest rate hikes), causing both to exhibit a tendency to move in the same direction during specific periods.
2. What implications does the Reserve Bank of Australia's (RBA) interest rate hike have for the US Treasury market in North America?
The policies of major central banks worldwide have a contagious effect. The RBA's explicit statement that inflation will substantially rebound in the second half of 2025 serves as a warning to global markets that inflation may be more sticky than expected and carries the risk of a double-dip recession. For the US Treasury market, this reinforces investors' expectations that the Federal Reserve will also maintain high interest rates or reduce the magnitude of rate cuts. This "hawkish linkage" has led to a sell-off in US Treasuries, causing yields to rise accordingly, which in turn affects the pricing of global risk assets.
3. Given the rise in US Treasury yields, why hasn't gold experienced a significant drop?
Typically, rising US Treasury yields (real interest rates) increase the cost of holding gold. However, the core reason for the current strength in gold prices lies in the fact that "geopolitical premiums" outweigh "interest rate pressures." Uncertainty surrounding navigation in the Strait of Hormuz and extreme concerns about disruptions to the energy supply chain have led investors to be willing to pay a higher premium to hold physical gold. As long as geopolitical conflicts do not substantially de-escalate, gold's safe-haven appeal will offset some of the selling pressure from the bond market.
4. Why should we pay attention to the "six consecutive days of gains" and "higher highs" in crude oil prices?
In current macroeconomic models, crude oil is not only a commodity but also a leading indicator of inflation. If crude oil prices continue to reach new highs and fail to fall below key technical levels such as the 8-day moving average, it means that market expectations for future price trends will be continuously revised upwards. This will force bond market participants to factor in higher inflation compensation, leading to an overall upward shift in the yield curve. Therefore, whether oil prices can stabilize below $93 and correct is a key turning point for observing whether the US dollar and US Treasuries will weaken.
5. What role did Trump's tariff rhetoric play in this market movement?
While the current focus is on geopolitical tensions, tariff rhetoric remains a persistent long-term market disruptor. Market anxieties triggered by tariff statements often increase future uncertainty, leading to a surge in risk aversion in certain sectors. For the US dollar, such rhetoric often has a potential upward pressure, as the market tends to perceive tariff policies as potentially inflationary. In the current complex situation, this, along with geopolitical factors, creates a complex bullish backdrop, increasing the difficulty of determining trend reversals.
The US dollar index retreated slightly to around 99.77 after reaching a high of 100.11, with safe-haven buying driven by geopolitical risks and high-level fluctuations in US Treasury yields providing strong support. Meanwhile, spot gold fluctuated around the $5,000 mark. Although the Middle East situation provided a solid safe-haven premium, hawkish expectations that the Federal Reserve might delay rate cuts limited further upside potential for gold prices. Overall, the market is closely watching the navigation situation in the Strait of Hormuz and the upcoming FOMC meeting, with liquidity remaining cautious amid volatility.
Energy premium drives bond market revaluation: How US Treasury yield volatility is reshaping the dollar's path
Analysis of the latest market data reveals that the recent strength of the US dollar index is primarily driven by the structural rise in US Treasury yields. Meanwhile, oil prices have repeatedly hit new highs in the past few trading days due to the risk of energy supply disruptions caused by geopolitical tensions. Technically, if oil prices do not break below previous lows and the 8-day moving average support level, their support for inflation expectations will continue.
This "inflation transmission" directly led to a steepening of the bear market in the US Treasury market. The 10-year US Treasury yield has fluctuated upwards from 3.925% to the current 4.2% range, and this increase in the yield premium has enhanced the interest rate advantage of the US dollar.
Fundamental Pressures: Federal Reserve watchers and analysts from well-known institutions point out that even before the escalation of the Middle East conflict, the US core PCE price index had already accelerated to 3.1%, far exceeding the target. The impact of the geopolitical situation may reinforce the Federal Reserve's "Higher for longer" policy stance.
Interest Rate Spread Momentum: The Reserve Bank of Australia (RBA) unexpectedly raised interest rates by 25 basis points today, citing a substantial rebound in inflation in the second half of 2025. This leading indicator has raised concerns in the market about whether the Federal Reserve will follow suit and withdraw its previous guidance on rate cuts.
US Dollar Movement: The 240-minute chart of the US Dollar Index shows that the price has broken through the upper Bollinger Band, and the MACD histogram continues to expand. Although it has retreated to around 99.77 in the short term due to profit-taking, as long as the 10-year US Treasury yield holds above the key support range of 4.05%-4.10%, the downside potential for the dollar will be very limited. Currently, the US Dollar Index is showing strong bullish momentum near the 100 level, and the market is digesting the valuation correction brought about by the stabilization of US Treasury yields at high levels.
Safe-haven premium and hawkish pressure: A life-or-death race for spot gold at the $5,000 mark.
Spot gold is currently exhibiting an extremely rare "high-level sideways" pattern. Data shows that the spot gold price (XAU) is currently at $5006.45, fluctuating narrowly around the $5000 mark multiple times during the session. Gold's price movement is caught in a struggle between two opposing forces: on one hand, the safe-haven demand stemming from geopolitical conflicts; and on the other hand, the squeeze on asymmetric assets caused by rising real interest rates following energy price inflation expectations.
Fundamental Analysis: The Middle East geopolitical situation has entered its third week, with navigation disrupted in the Strait of Hormuz and new energy facilities impacted, directly locking in gold's "geopolitical floor." However, prominent economic advisors and research institutions believe this impact may be short-lived. If the situation is brought under control within weeks, the safe-haven premium for gold faces the risk of a rapid decline.
Technical Analysis: The 240-minute candlestick chart shows that gold prices have recently been fluctuating within a broad range of 4900–5600. Currently, the price is approaching the Bollinger Band middle line at 5055.62, which is considered a neutral to slightly bearish zone. The MACD indicator shows the DIFF and DEA lines in a bearish alignment, and the RSI's three lines are averaging around 39.78, suggesting insufficient bullish momentum in the short term.
Key Range: The strength of support at the $5,000 level is crucial for gold prices. If geopolitical tensions do not ease substantially, gold is likely to consolidate above this level; however, if the upcoming FOMC meeting releases an unexpectedly hawkish signal, causing US Treasury yields to rise further, a retest of the lower Bollinger Band support is possible.
Outlook for the next 2-3 days: Forward-looking logic of geopolitical games and the Fed's decision
Looking ahead to the next 48 to 72 hours, the market will enter a period of extreme sensitivity. With the Federal Reserve entering its interest rate meeting window, the market lacks official guidance, and marginal changes in the geopolitical situation and economic data will become the main drivers of pricing.
From the perspective of US Treasury bonds, the 10-year Treasury yield is likely to fluctuate within a wide range of 4.05% to 4.30% in the short term. If the February pending home sales index remains weak, it may somewhat restrain the rise in yields, thereby slowing the rise of the US dollar. However, the core focus remains on oil prices—if crude oil fails to break below the key support level of $92.93 and end its consecutive gains, concerns about double-dip inflation will continue to push up bond yields, thereby driving the US dollar index to challenge above 101.
For gold, its price movement over the next 2-3 days will depend on the balance between "safe-haven confidence" and "interest rate concerns." Barring further deteriorating geopolitical news, gold prices are likely to consolidate around the $5000 level. Investors should closely monitor the recovery of the Bollinger Band middle line at $5055. Overall, the market is in a period of strong volatility followed by a directional decision-making phase, and the resilience of the US dollar and gold's safe-haven appeal will maintain a strong connection amidst high volatility.
Frequently Asked Questions
1. Why do the US dollar and gold both show strength when the geopolitical situation in the Middle East escalates?
This phenomenon is often referred to as "safe-haven resonance." During periods of geopolitical instability (such as the current situation in Iran), gold, as a traditional safe-haven asset, attracts inflows of safe-haven funds, driving up its price. Similarly, the US dollar, as the world's core reserve currency and the most liquid asset, also possesses safe-haven attributes during geopolitical crises. The unique aspect of this instance is that rising energy prices directly boosted US Treasury yields, providing the dollar with double support from an interest rate differential perspective (safe-haven demand + expectations of interest rate hikes), causing both to exhibit a tendency to move in the same direction during specific periods.
2. What implications does the Reserve Bank of Australia's (RBA) interest rate hike have for the US Treasury market in North America?
The policies of major central banks worldwide have a contagious effect. The RBA's explicit statement that inflation will substantially rebound in the second half of 2025 serves as a warning to global markets that inflation may be more sticky than expected and carries the risk of a double-dip recession. For the US Treasury market, this reinforces investors' expectations that the Federal Reserve will also maintain high interest rates or reduce the magnitude of rate cuts. This "hawkish linkage" has led to a sell-off in US Treasuries, causing yields to rise accordingly, which in turn affects the pricing of global risk assets.
3. Given the rise in US Treasury yields, why hasn't gold experienced a significant drop?
Typically, rising US Treasury yields (real interest rates) increase the cost of holding gold. However, the core reason for the current strength in gold prices lies in the fact that "geopolitical premiums" outweigh "interest rate pressures." Uncertainty surrounding navigation in the Strait of Hormuz and extreme concerns about disruptions to the energy supply chain have led investors to be willing to pay a higher premium to hold physical gold. As long as geopolitical conflicts do not substantially de-escalate, gold's safe-haven appeal will offset some of the selling pressure from the bond market.
4. Why should we pay attention to the "six consecutive days of gains" and "higher highs" in crude oil prices?
In current macroeconomic models, crude oil is not only a commodity but also a leading indicator of inflation. If crude oil prices continue to reach new highs and fail to fall below key technical levels such as the 8-day moving average, it means that market expectations for future price trends will be continuously revised upwards. This will force bond market participants to factor in higher inflation compensation, leading to an overall upward shift in the yield curve. Therefore, whether oil prices can stabilize below $93 and correct is a key turning point for observing whether the US dollar and US Treasuries will weaken.
5. What role did Trump's tariff rhetoric play in this market movement?
While the current focus is on geopolitical tensions, tariff rhetoric remains a persistent long-term market disruptor. Market anxieties triggered by tariff statements often increase future uncertainty, leading to a surge in risk aversion in certain sectors. For the US dollar, such rhetoric often has a potential upward pressure, as the market tends to perceive tariff policies as potentially inflationary. In the current complex situation, this, along with geopolitical factors, creates a complex bullish backdrop, increasing the difficulty of determining trend reversals.
- Risk Warning and Disclaimer
- The market involves risk, and trading may not be suitable for all investors. This article is for reference only and does not constitute personal investment advice, nor does it take into account certain users’ specific investment objectives, financial situation, or other needs. Any investment decisions made based on this information are at your own risk.